Using data to combat environmental destruction

If the environment were in a boxing match with capitalism, it wouldn’t exactly be winning. But rather than fomenting guilt, a few companies are taking a systems-level look at ecological issues and applying design thinking principles to nudge the economy and the environment back into alignment.
In the natural ecological order, most matter gets reused in an endless cycle. But the modern economy has wrenched from the circle of life because it encourages a linear “extractive industrial model” where resources are converted into non-recyclable matter that simply piles up, reports the Ellen MacArthur Foundation. Bacteria that are accustomed to munching on tanbark can’t eat plastic bottles and, as humans burn fossil fuels, trees can’t scrub the air fast enough. The system is backed up.
Product teams that are accustomed to battling churn will recognize this challenge for what it is: a systems failure. To fix things, they must harness the profit motive and turn the natural world into data.
Recycling doesn’t always mean what we think it means
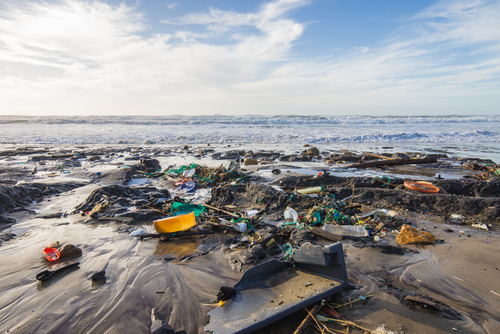
There’s no discussing the planet’s health without mentioning the 12 billion tons of non-biodegradable plastic humans will slough off by 2050. Governments, academia, and businesses are keen to understand its effects but are stuck peering into a black hole of data.
“People have enormous amounts of data on what plastic is made,” says Adrian Griffiths, founder of Recycling Technologies, a chemical recycling equipment startup. “But no one keeps data on what happens to it after people throw it away.” The post-use lifecycle is a mystery, partly because plastics are, by design, impractical to track.
Plastics used in packaging are lightweight and cheap, so it takes literal tons of discarded material for them to be worth anything. And while humans generate plenty of plastic—one million bottles every minute, according to The Guardian—pieces are scattered and constitute a menagerie of sizes, qualities, and composites. It’s difficult to collect and sort, and nobody wants much of it.
“All people can do to collect data on where plastics go after they’re used is to analyze whatever waste shows up at recycling facilities,” says Adrian. Unfortunately, that ends up being only a small fraction of the total volume waste out there.
Only nine percent of plastics is ever recycled. Some is incinerated and the remaining 79 percent is dumped into landfills or lost to the environment. For anyone who is feeling optimistic about that nine percent, Adrian has news: Recycling doesn’t always mean what most think it does.
“Though Europe talks about recycling 7.7 million tons of plastic, much of it gets sent to the far East and isn’t properly disposed of. It’s a similar story for the U.S. As much as 50 to 60 percent of the material shipped never arrives at a recycling plant,” says Adrian, “because they scrap anything if it’s the wrong material, wrong color, or they couldn’t get the label off.” In Europe or the U.S., companies would have to dispose of this material in incinerators or landfills, but in China or India, much of it gets thrown into rivers.
“If you connect that with data that says that 86 percent of the plastic in the oceans comes from 10 rivers in the world and eight are in countries where the Europe and the U.S. send their plastic, it tells a clear story,” says Adrian. “People talk about plastic in the ocean and say, ‘Well, it’s not our country.’ But if you ask what actually happens to the material, you realize it’s our problem too.”
To begin to solve the leakage of non-biodegradable material, the world needs an understanding of the full lifecycle of discarded plastics, more transparency and accountability, and more ideas for what to do with the rubbish. That’s why Recycling Technologies has built a machine that offers answers to all three. It’s the size of a several stacked shipping containers and turns plastic into oil, and then oil into data.
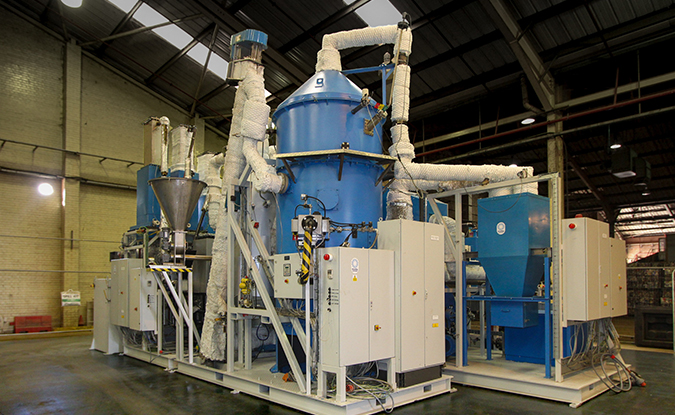
The RT7000 uses a process known as thermal cracking to break plastics back down into their primary components. While Recycling Technologies didn’t invent thermal cracking, Adrian and his team are the first to productize it so that the oil can be sold back to petrochemical companies. Adrian’s background is business and for him, the profit motive is a powerful agent for change. “You have to unleash the power of profit,” says Adrian. “You need people working on these issues to be motivated.”
Recycling plastics is typically only profitable when the price of crude oil, from which plastics are made, is high. When the price of oil drops, people stop recycling and start dumping plastic. Adrian’s goal with RT7000 was to make recycling profitable even during an all-time low.
The RT7000 also addresses the issue of plastics being so lightweight and so geographically scattered that they can’t be transported. “It wouldn’t make economic sense to transport the plastics to the machine,” says Adrian. “You have to take the machine to the plastic.” This is why Recycling Technologies hasn’t just developed a recycling machine; it has built an assembly plant to mass-produce RT7000s.
“Our machines produce oil, but we also produce data,” explained Adrian. “When we process the data, we can measure the quantity, quality, and materials around the planet.” Because the RT7000 allows businesses to make money off recycling, there’s an incentive for people everywhere to recycle what’s sitting in landfills, and to keep plastics from flowing into rivers. The oil the machines produce can be sold back to the same chemical companies that produce the plastics in the first place. Then, governments, academics, and businesses can access data on how the lifecycle works. Recycling Technologies has engineered a way to fill in the data black hole and, at least partly, bend the line of the plastics economy back into a circle.
Data, Adrian hopes, will help guide the plastics industry to make more sustainable choices. “The idea is that there’s two-way traffic in this data, because petrochemical companies and recyclers can communicate,” says Adrian. “We achieve sustainability when businesses only produce what they know will get reused.”
Helping power grids produce data
Data black holes aren’t unique to plastics. Power grids have them too. For David Klatt, Vice President of Operations and Head of Product for Energy Technology Savings (ETS), his journey into helping the energy economy produce data began with the question, “How much energy do buildings use?” It ends up, nobody, including utilities, knows for sure.
In New York City, which features the second highest residential electricity prices in America, neither building managers nor owners nor power providers know how much energy individual buildings use on an hour-by-hour basis. It’s impossible for them to see which behaviors, such as running AC units, impact total billings in the course of a month. What might change if buildings knew exactly how they used power in the moment they use it?
“After years at Bank of America Merrill Lynch focused on wholesale electricity markets and utilities, I was introduced to energy management technology at the user level where the electricity is actually consumed by systems and devices,” says David. “I learned about this whole world behind-the-meter and end-users’ need for more precise tools.”
The issue lies in how the U.S. power grid has grown over the past 100 years. When Thomas Edison created the first power plant in lower Manhattan, it powered the J.P. Morgan building. The feedback loop was so local it was literally door to door. As the need for power grew, the grid expanded and centralized. The U.S. built bigger plants farther away and power operators lost access to the specific, granular usage data for individual payers. In the 21st century, as technology allows the system to decentralize again, it’s “exposing how insufficient the utility’s measurement and verification technology is,” says David.
“Onsite solar, batteries, building controls, cogeneration—it’s all become cheaper and, in many cases, it makes sense to produce power onsite,” says David. “But the utility can’t always tell who’s producing or consuming what with much detail. In New York City, smart meters are not prevalent. There are about 15,000 buildings that are 50,000 square feet and above whose power billing is very significant, but the bill is all based on just 2 data points per month per building. The peak 30 minutes of consumption and total kilowatt hours consumed.”
This regime assumes that all energy is equal, which it is not. “Whenever more power is used than was planned, the power grid downshifts to less and less efficient power sources. It runs out of nuclear, wind, solar, and hydro and switches to fossil fuels like gas and oil.” Energy consumed at peak times thus causes many times more environmental degradation than at non-peak times.
This is a serious issue because without data, power grids can’t plan. “Consider a football stadium versus a widget factory that’s open 24/7,” says David. “The football stadium doesn’t use a lot of cumulative electricity, but when it does, it uses a massive amount. The widget factory, on the other hand, uses a lot more overall, but its consumption is very consistent. They put different types of strains on the grid, and the grid needs to build infrastructure for both and carefully plan for spikes.”
If football stadiums, factories, buildings, and power grids could all measure and forecast data more accurately, they’d become more sustainable. This requires data, which is what ETS provides.
ETS outfits buildings with hardware control systems, smart meters, sensors and software which capture buildings’ data, make it accessible to managers, and pass the data back to utilities. “We upgrade buildings to a much more data intensive regime,” says David. “With the ETS Smart Building AI Platform, SmartKit AI, buildings capture over 3,000 data points per month to generate their energy bill.” On top of that, building owners and managers can, for the first time, understand how their actions impact usage in real-time. “It changes how buildings operate because owners and managers can make real-time decisions to lower their bill,” says David.

What has David’s team learned from lighting up buildings with data? For one, common areas of multifamily buildings are a big energy suck. They take up 10 to 15 percent of the square footage of a building, but half of the building’s energy, via pumps, lights, elevators, heating, and cooling. They’ve also found that older buildings are sometimes more energy efficient than newer ones.
“There’s this false assumption that new buildings are super energy efficient because they use newer technology,” says David. “But a lot of times, it’s actually the other way around.” Old buildings have fewer energy systems, whereas new buildings often pump in more fresh air, which consumes more energy.”
With insight, energy regulation becomes a matter of automating how buildings use or don’t use cooling, heating, and water, as well as trying to predict and nudge building managers through what the ETS team calls human behavior management.
“Step one is creating transparency,” says David. “When people understand in real time how much energy they’re consuming, it makes them think about it differently. We generate data where it didn’t exist before and turn that data into insight, which guides energy efficient activities.”
ETS provides analytics via a mobile and desktop app that gives building owners and managers goals, alerts, and advice, and includes elements of gamification. “Human behavior management is delicate. You can’t expose everything, or people get fatigued,” says David. “If there are 20 energy efficient activities that can be done in a given building, that’s a lot of work.” The team has found, however, that by occasionally putting managers on high alert, say, due to weather events, they shift their long-term behavior. “If we put people on DEFCON 1 five to ten times per year, they learn to live at DEFCON 3,” says David.
The data ETS generates allows buildings to save energy and allows power grids to forecast more accurately. And like Recycling Technologies’ oil recycling machine, businesses happily adopt ETS’s Smart Building AI Platform out of their own self-interest. By monetizing sustainable behavior, ETS is plugging buildings all across the country both into a power grid and a data grid, which nudges everyone in the right direction. “Our programs save building owners money,” says David, “and sustainability comes along with it.”
Does the world have reason to be optimistic about the environment?
“The way I see it, let’s just get back to net-positive,” says Adrian. “If you’re in an airplane that’s in a nose dive and you can wrestle it back into a glide, you’re still losing ground, but at least you’ve bought yourself more time to think about it.”
Adrian is hopeful that a data-driven approach will help get the planet into glide mode. “I think by nature, you have to be optimistic. When you have kids, you’re attached to the planet and it’s the only one we’ve got. There are lots of incredible minds out there working on solutions that are great for both the world and the economy and you have to believe in their ingenuity.”
David feels equally sanguine. “I’m optimistic. There are lots of things happening in New York that hint at a much larger shift, and it’s a fun time to be a part of the environmental economy. More than anything, I love that what I build now is physical and tangible. It’s great putting a product into someone’s hands, having them use it, and having the data confirm that we’re actually changing behavior for the better. As someone who used to sit at a trading desk and watch numbers move on a computer screen, there’s nothing more gratifying than that.”