6 Steps to become a Mixpanel expert
Become a Mixpanel Expert in 6 Steps

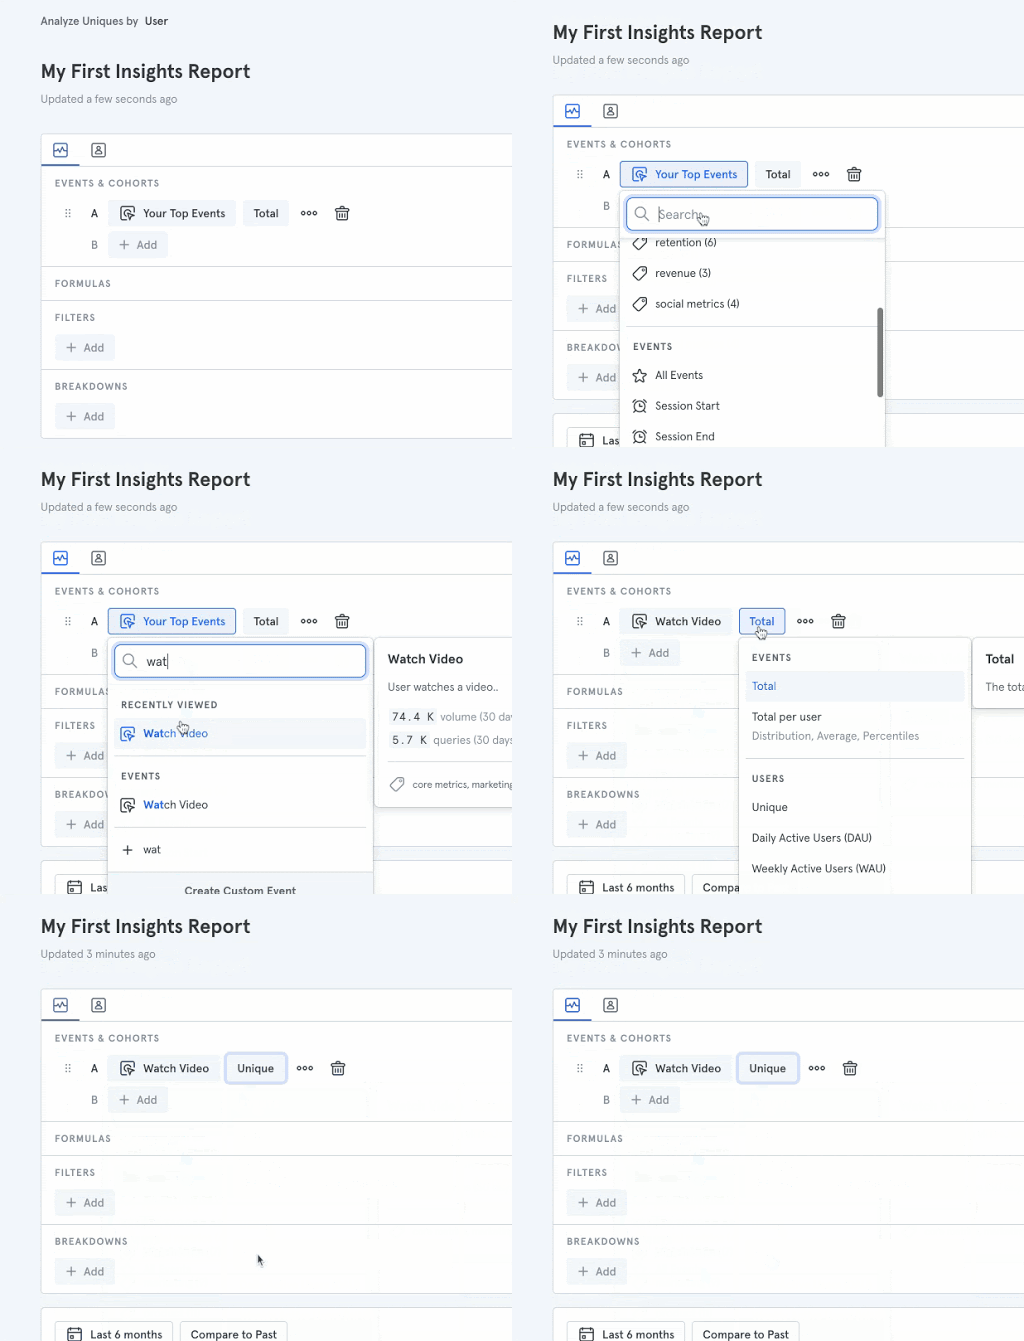
Select an event
Step one is easy. Go to Insights in your project and select an event.

Remember that an event is a data point that represents an interaction between a user and your product. Events can be a wide range of interactions. For example, a music service might track a new user signing up for an account or a user playing a song as an event. Once you select yours, Mixpanel will graph the data for you so you can explore trends over time.
Like you, we’re in the business of building great products that keep our users engaged. After looking at our own data, we’ve pinpointed the key actions that turn new users into power users. There’s just 6 steps that’ll take you from a Mixpanel newbie to expert, all laid out below.
These lessons introduce you to the Insights report in Mixpanel, our most popular report for segmentation and analysis. Once you’ve mastered that report, the others will feel familiar to you.
Totals, Uniques and Other Functions
Next to where you selected an event, you see a little box that says Total. That’s the function drop down which lets you select which calculation to perform on your event data.
The total means: how many times was this event performed?
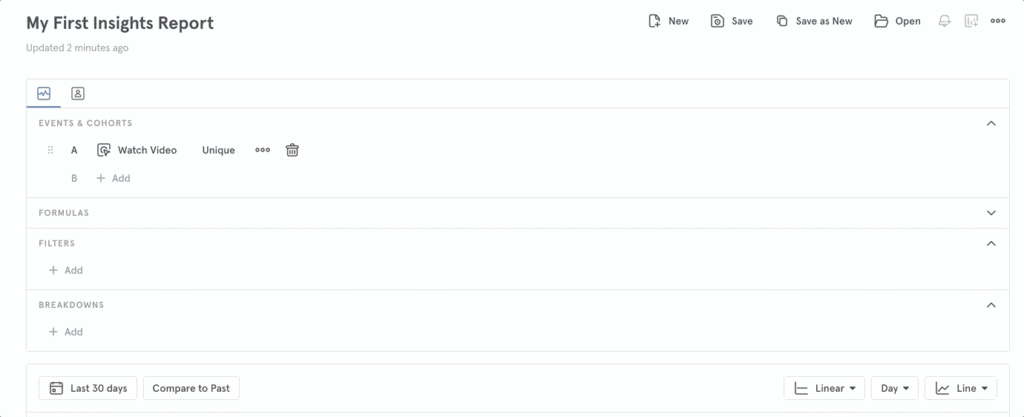
Okay, now go to your report and switch the function to Unique. That means: the number of users that performed your event.

Breakdowns
Okay, so you selected an event and looked at the number of users that performed it. That’s great! Let’s see how you can turn that data into insights.
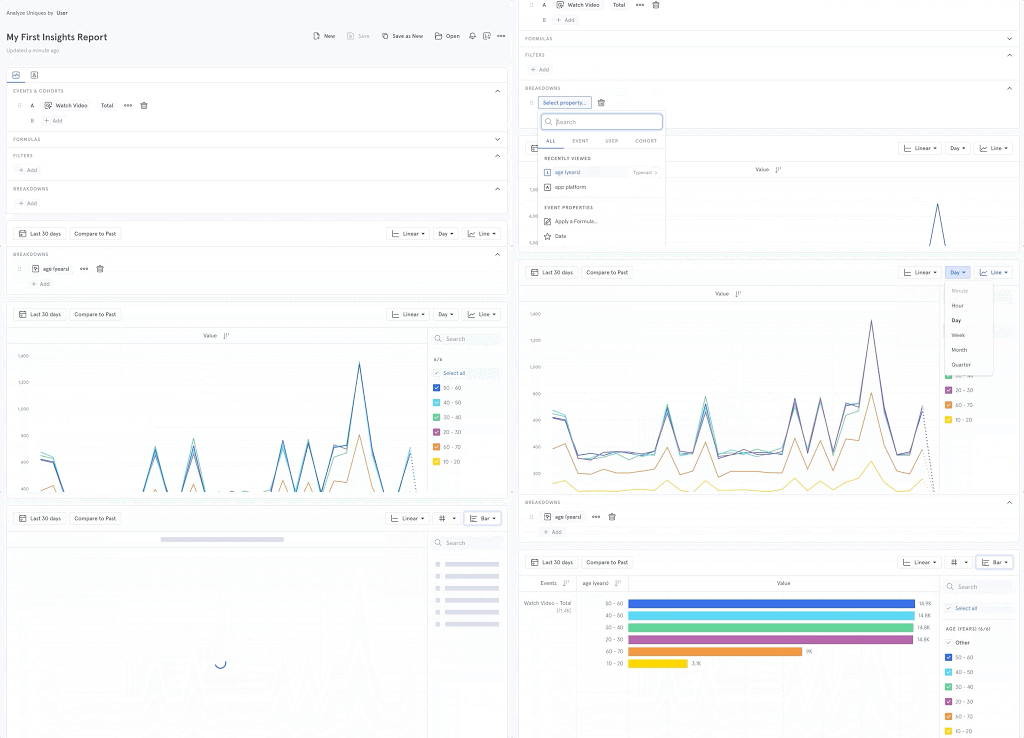
Our next lesson is to break down your event data by properties (aka the nitty gritty details of each event your users perform). When you break down an event by property, this means that you group it into values based on that property. What TV shows did your users watch? What items did they purchase? You get the drill.
Go to the BREAKDOWNS section of the Insights query builder and click + Add to select a property.

(Don’t see the properties you need? You may need to tweak your implementation. The right Mixpanel implementation evolves over time, because your product is constantly improving. It’s good to build this muscle.)
Filter
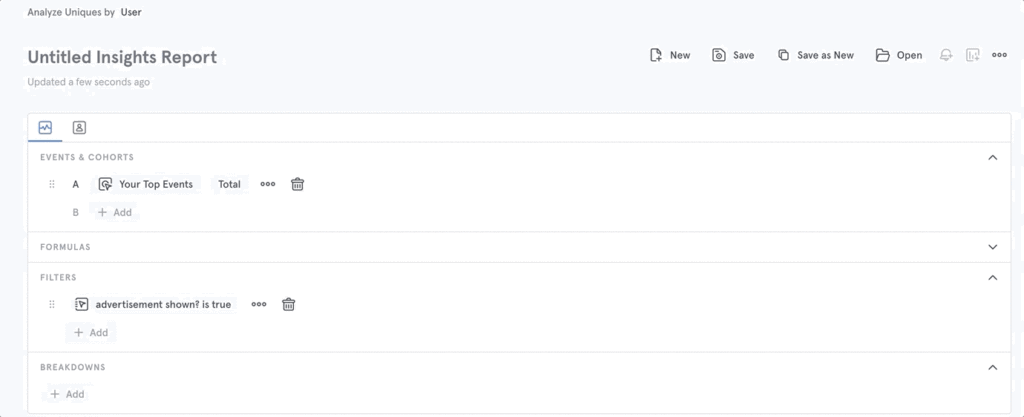
Now let’s look at filters. Use them to decide which event data to include in your analysis. You can filter by properties or cohorts, but the point is that you narrow your scope to a smaller set of data.
In the FILTER section of the Insights query builder, click + Add.

Time
There’s every-day apps, every-week apps, and some apps that you only need on special occasions. Depending on your product, you will need to look at your data in different time horizons. This stupidly simple lesson is to change the time range for your report.
By default, Mixpanel shows you the Last 30 days. Click on it to open the date selector and pick something else.

Share and save
In the previous lessons, we’ve covered events, breakdowns, filter, and date ranges. It’s tempting to jump to other types of reports, but let’s save what we have built first!

Now go ahead and share the report with your favorite co-worker or drop it into chat.
And, that’s a wrap! We hope this helped. Looking for more tips? Hungry for more learning? Join the fray at QBQ | The Mixpanel Community.