What is product management analytics?
Product management analytics tools capture data from digital products to reveal insights about the user experience, helping teams build better products.
At a more granular level, product management analytics tools track the actions users take—known as “events”—and make that information accessible to product, growth, and engineering teams so they can query it in reports. With access to precise information about user segments, cohorts, and funnels, businesses can make informed decisions about what features to build and how to tweak the product to maximize retention, conversion, and growth.
But product management analytics can only tell you what’s happening in your product—it can’t actually make changes. Put another way, simply having the tool doesn’t guarantee greater insight; you still have to ask the right questions, track the right product metrics, and act on the insights.
In this post, we’ll go over the following:
- Why product management analytics matter
- How to choose metrics for product management analytics
- Common metrics for product management analytics
- How to analyze, understand, and report on product management analytics
- How to choose the right product management analytics tool
Why product management analytics matter
At the end of the day, there are an unlimited number of things you can do to make a better product. The role of data is to guide the decision-making process, which minimizes the risk of trying something new. You wouldn’t build a product or feature that you thought no one was going to adopt.
Product development teams use analytics to look at what people “have done” and what they “haven’t done” and use that to inform what they are “going to do.”
Take modern insurance company Lemonade, for example. Their product team discovered that new policyholders weren’t fully completing the purchase flow. To finalize a policy with “Extra Coverage”, a user had to submit their policy for review. At this stage, there’s no need for payment, but most people didn’t submit it for review at all. Product analytics helped the team at Lemonade understand what was behind the staggering drop-off rate: a combination of a browser-based technical issue, and a confusing call to action.
Tackling both the technical and the UX issues led to a dramatic improvement: the product team saw a 50% increase in overall conversion for extra coverage.
How to choose metrics for product management analytics
Goals, KPIs and metrics
Though often used interchangeably, goals, key performance indicators (KPIs), and metrics are not the same. Rather, they sit in a hierarchy, with goals on top. Goals are a company’s highest level priority, such as driving revenue; KPIs measure progress toward goals; and metrics measure progress toward KPIs.
Once teams select their goals and KPIs, they can determine the metrics that support them. No two companies are the same, and there’s no “correct” set of measurements for any given business. Each instance is unique.
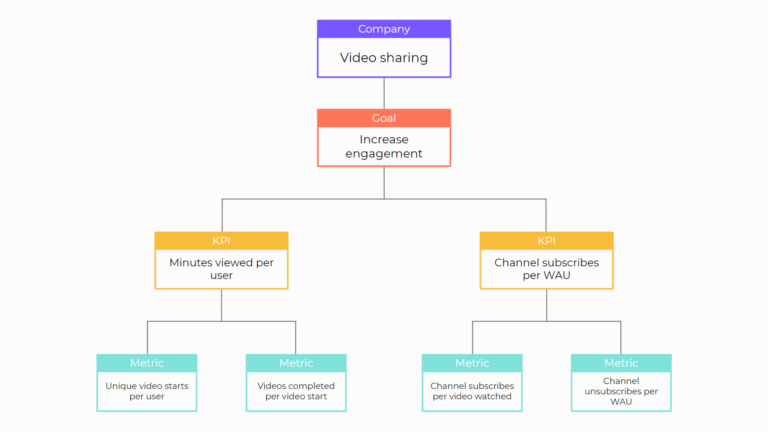
Ad-supported companies like social media sites might use engagement and retention metrics because those businesses are concerned with the amount of time users spend using their products. On the other hand, purchase-driven companies like those in e-commerce will be more focused on transaction metrics that measure direct revenue. Each type of metric is valuable—especially when used in conjunction—but their use cases can vary widely.
Product metrics categories
Product management metrics are usually divided into a few different categories based on what part of the user lifecycle they’re intended to measure:
- Engagement: How deeply, or frequently, do users engage with your product? This could be the number of key actions taken or minutes of video watched.
- Retention: What proportion of users come back to use your product? This is usually measured across 7-, 30-, or 90-day periods.
- Activation: How quickly do users reach a point that helps them realize value? This could be making a first purchase or listening to three podcasts.
- Reach/Acquisition: How broad of a user base does your product have over a recent time period? This could be the number of paid accounts or licenses in the past year, or the number of users who made a purchase in the past three months.
- Transaction/Monetization: How many, or how often, are transactions made? How well is usage of your product translating to revenue for the business? Transaction metrics can cover anything from retail or in-app purchases to revenue and ad conversions.
- Business-specific: Metrics specific to your business model. For example, an e-commerce company might want to track average order value.
Choosing the right metrics hinges upon having a very clear understanding of your product’s value moment—a concept we cover extensively in our Guide to Product Analytics.
Product management analytics and the modern data stack
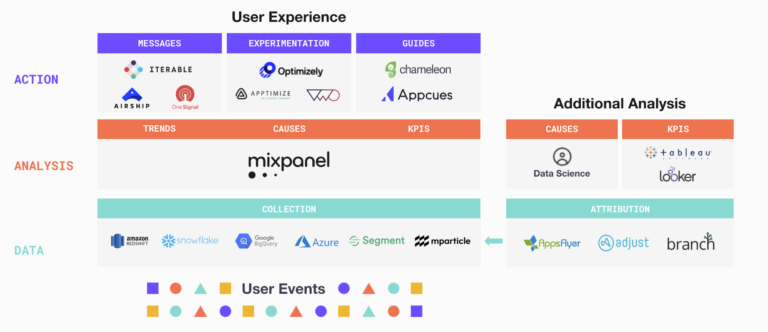
Finally, a sophisticated data stack will look at data across the entire user experience, with different tools for data collection, analysis, and action.
The modern data infrastructure ecosystem looks like something like this:
Common metrics for product management analytics
Hopefully, it’s clear by now the importance of selecting only those metrics that help you determine your product’s success. Tracking too many metrics often proves unmanageable—like a car dashboard with too many gauges. Every metric that’s chosen should be clearly defined, simple to collect, and roll up into KPIs and goals.
We’ve outlined some of the most common product management metrics below:
Engagement metrics
- Average daily active users (ADAU)
- Time spent on site or app
- Pages viewed
- Session per user
- Shopping cart or checkout abandonment
Retention metrics:
- Retention or churn rate
- Stickiness
- N-day retention
Activation metrics:
- Percentage of activated users
- Number of activations
- Number of activation funnel steps completed by an average user
Reach/Acquisition metrics:
- Paid subscribers
- 3-month active users
- Page or ad impressions
Transaction/Monetization metrics:
- Monthly recurring revenue (MRR)
- Average revenue per daily active user (ARPDAU)
- Customer lifetime value (CLV)
- Ad click-through rate (CTR)
- Cost per acquisition (CPA)
(For a detailed overview of product management metrics and how to measure them, check out our Guide to Product Metrics.)
Once teams are successfully tracking the right metrics for their product, they can begin their analysis and turn data into useful insights.
How to analyze, understand, and act on product management analytics
For product management analytics to provide actionable answers, you need to combine insights across multiple sources, ask logical questions, and perform experiments. That means creating hypotheses about how everything will fit together, and then testing it to see how it holds up in reality.
Digital transaction management and e-signature provider, DocuSign, for instance, reasoned that by exposing certain gated premium features to free plan users, they could incentivize them to upgrade their plans. To test their hypotheses, they used Mixpanel’s Funnels report to track which features drove conversions from freemium to paid plans. The team’s analysis demonstrated that feature walls resulted in a 5% lift in upgrade conversions—and given that the company sees 130K new unique users every day, this was a significant boost.
There are a variety of different analyses available to understand your metrics. Here are a few of the most useful types of product management analyses:
Segmentation: In-depth analysis of data done by dividing users by the characteristics they share, such as behavior, signup date, or marketing source. Data-driven product teams can compare the metrics and KPIs of different groups and draw distinctions between them. For instance, users who came from a particular marketing source might be 3x more valuable than the average user. Or users under 25 years old might be twice as engaged.
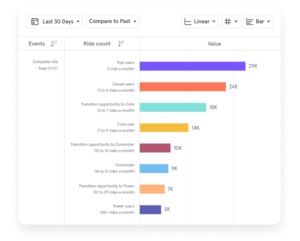
Cohort analysis: A cohort is a segment of users, usually grouped based on their behavioral or demographic attributes, that has been named and saved for future comparison. For example, a news site might save two cohorts: one for its paying subscribers and one for its free visitors. Each has different behaviors and interests, and the team can cater to each without offending the other.
There are two types of cohorts: absolute and relative. Absolute cohorts track a fixed group of users, such as those who signed up during the week of a particular conference. Relative cohorts track a shifting group of users, such as those who signed up within the past 30 days. Tracking the growth of key relative cohorts over time is a great way to measure product health.
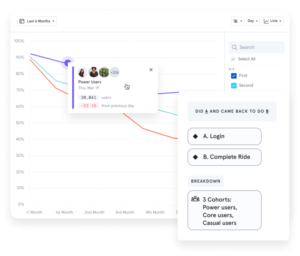
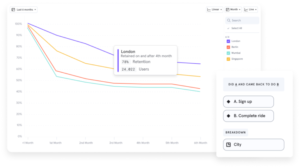
Retention analysis: Retention analysis measures how well digital products keep users coming back. Every company measures retention differently, but it’s typically tied to repeat actions. A free social media app might define retention as any user coming back to like a piece of content within seven days. An enterprise security software might define it as a user renewing their subscription after one year.
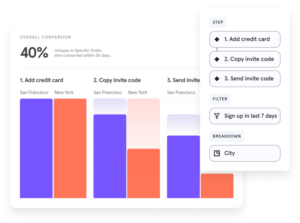
Funnel analysis: Funnels measure a series of steps users take toward a desired outcome such as a purchase. Funnels help reveal the health of processes like onboarding, and show teams where users drop off or get lost.
Once teams have collected statistical insights, they need to translate the data into user stories so that they’re useful to the rest of the company. Simply knowing that eight-week user retention is 20 percent, for instance, doesn’t mean anything on its own. But knowing that eight-week user retention doubled to 20 percent after the company offered its users discounts is a story that everyone from the customer success to the sales team can understand and use.
How to choose the right product management analytics tool
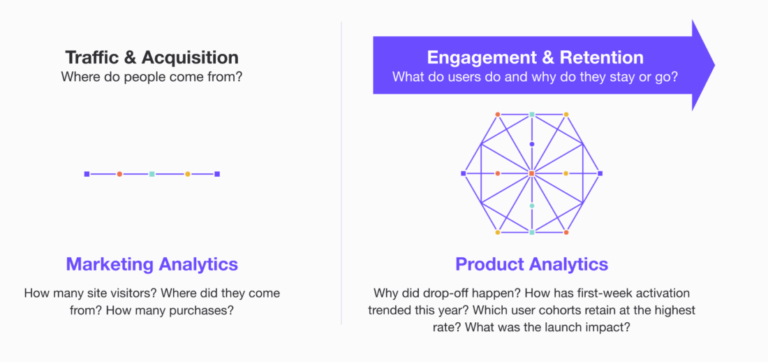
The best product management analytics tools are ones that teams can grow into. Companies that scale quickly typically outgrow codeless solutions, and marketing analytics platforms which, while essential, don’t provide the deep user insights needed to fuel product development. Switching from one platform to another can be a technical challenge, as can building your own DIY version.
Here are five factors for your team to consider when evaluating analytics platforms:
- Breadth of tracking: Can it track the right operating systems, channels, and events?
- Integration with other tools: Does it offer lots of pre-built integrations and flexible APIs?
- Resources needed to implement: What expertise is needed and how much will it cost in terms of development resources?
- Price: Does the price match the product’s business model? Are there price breaks at scale?
- Support: Does the vendor provide lots of hand-holding? Is that because the service is difficult to use?
After deciding to purchase a tool, teams should prepare for their implementation—a key milestone that sets an organization up for success with analytics. A careful implementation ensures so that the right user events get tagged with a sensible nomenclature that can outlast the current team.


