![pas-hero[1]](https://mixpanel.com/wp-content/uploads/2020/11/pas-hero@2x1.png)
You already know that product analytics is critical to innovation and growth.
Maybe you’re a disciple of the product-led growth school of thought, or you harbor a professional envy of Airbnb’s data team, but the prospect of going from 0 to 60 seems daunting. In this guide, we break down the success requirements for product analytics—and how you can work your way up to an Expert level of maturity.
Product analytics maturity means:
- Collecting the right data
- Asking the right questions
- Using data for cross-functional product decision making
More than anything, it means directing your attention toward specific success metrics for your product. Product analytics will help you identify hidden trends in user behavior, uncover product flows that lead to churn, and get real-time insight into product usage.
But first, you have to assess your own capabilities and product analytics goals.
At Mixpanel, we’ve consulted thousands of companies—from bootstrapped startups to leaders in tech. We know what “good” looks like, and we’ve developed a formula to get companies to “great.”
What will you learn here?
In order to improve their products, companies must know what questions to ask—and the tools that can answer them.
By assessing your product analytics maturity, you’ll see the possibility (and benefit) of moving product data from the periphery to the center of product decisions.
This guide helps you determine:
- Your current product analytics maturity
- Where you want to land on the maturity scale
- What you need to do to get there
- Why it all matters to product and company growth
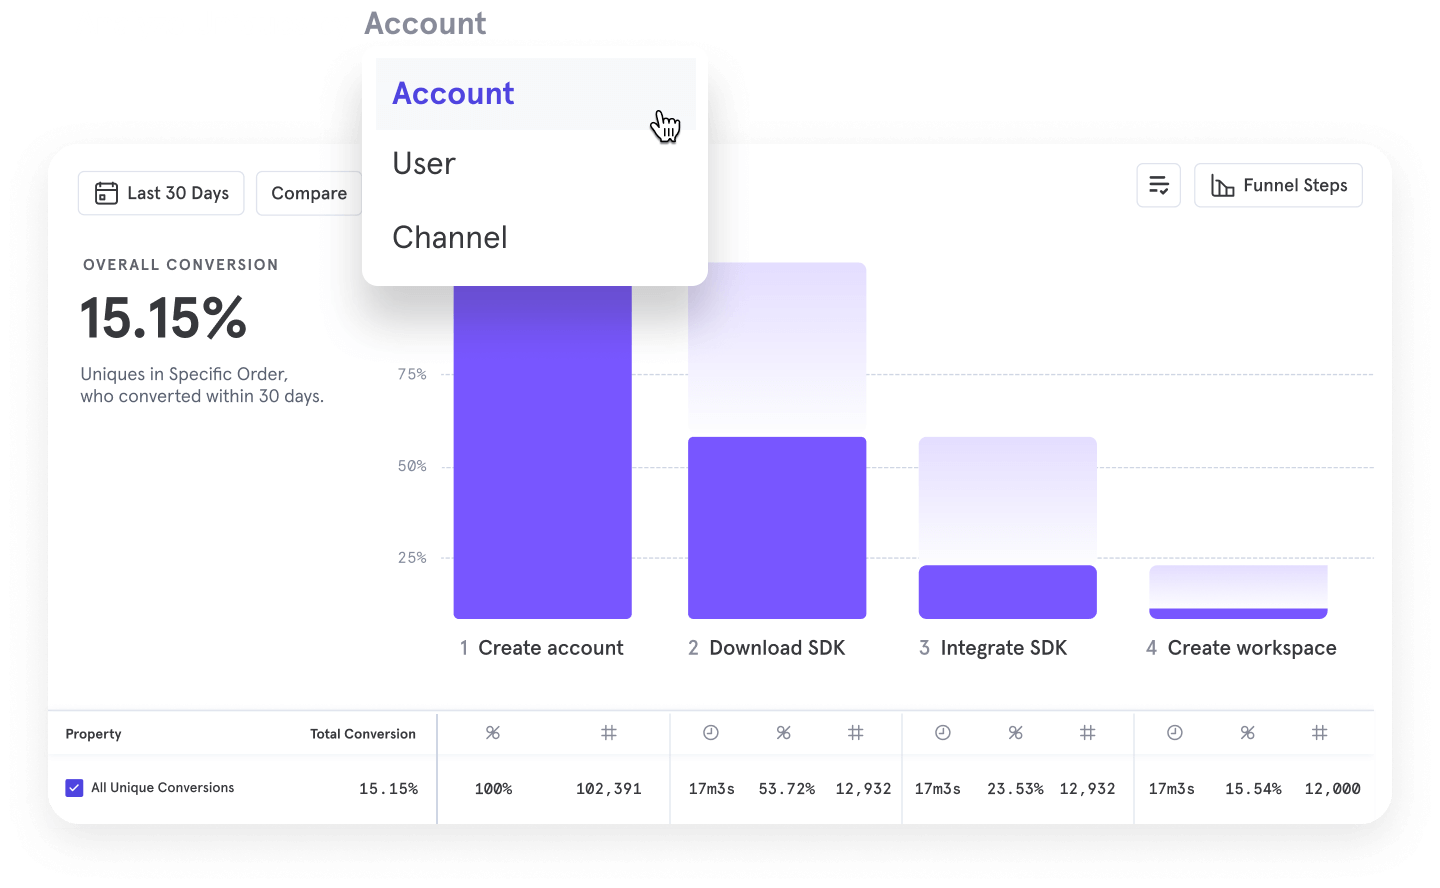
Explore Mixpanel
See how product and growth teams use Mixpanel’s powerful reports to answer any question.
Try It With Sample DataWhat is product analytics maturity?
Product analytics is not just about setting up a tool. It’s a discipline that requires the right tool, along with limitless curiosity.
Product analytics maturity refers to where a company stands in the product analytics lifecycle.
What makes a company more mature in product analytics?
At its core, product analytics is made up of four pillars: data collection, depth of analysis, collaboration, and product metrics.
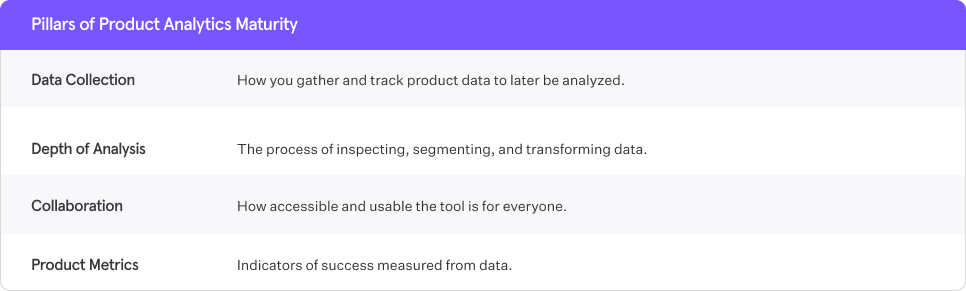
Your product analytics maturity determines your capability within each of these areas—and ultimately how you’re relying on your data to make product decisions. Throughout the guide, we’ll be using a fictional company (a ridesharing app) to help you understand what this looks like in practice.
Product maturity comes in stages—it’s sequential, but not necessarily consecutive. Teams can jump from Novice to Advanced product analytics maturity, as long as they’ve collected the right data, focus on the right questions, and have the right tool.
The tools you use matter
more than you think
Ultimately, the depth of insights that you can ask of your tool—or that you’re asking of your own product—is the primary driver of maturity.
To avoid hitting roadblocks with basic tools that track only default activities, take time to identify the events, properties, sessions, and all the user data you want to track.
Mixpanel supports product analytics at every stage, from foundational questions to sophisticated analysis for product and user growth.
Select a product analytics tool that will make running analysis straightforward, and is easy to use regardless of your technical abilities. If you’re already using an advanced product analytics tool but not to its full capabilities, this guide will help you get the most out of it.
Why knowing your product
analytics maturity matters
Product analytics lets you answer key questions about your product and users—but you can’t answer the most essential questions if you’re unsure of your product analytics capabilities.
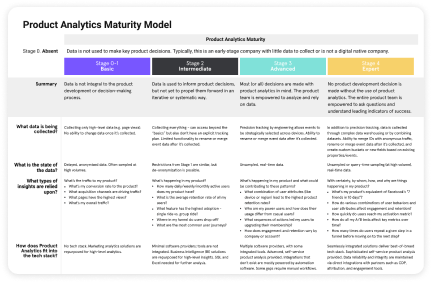
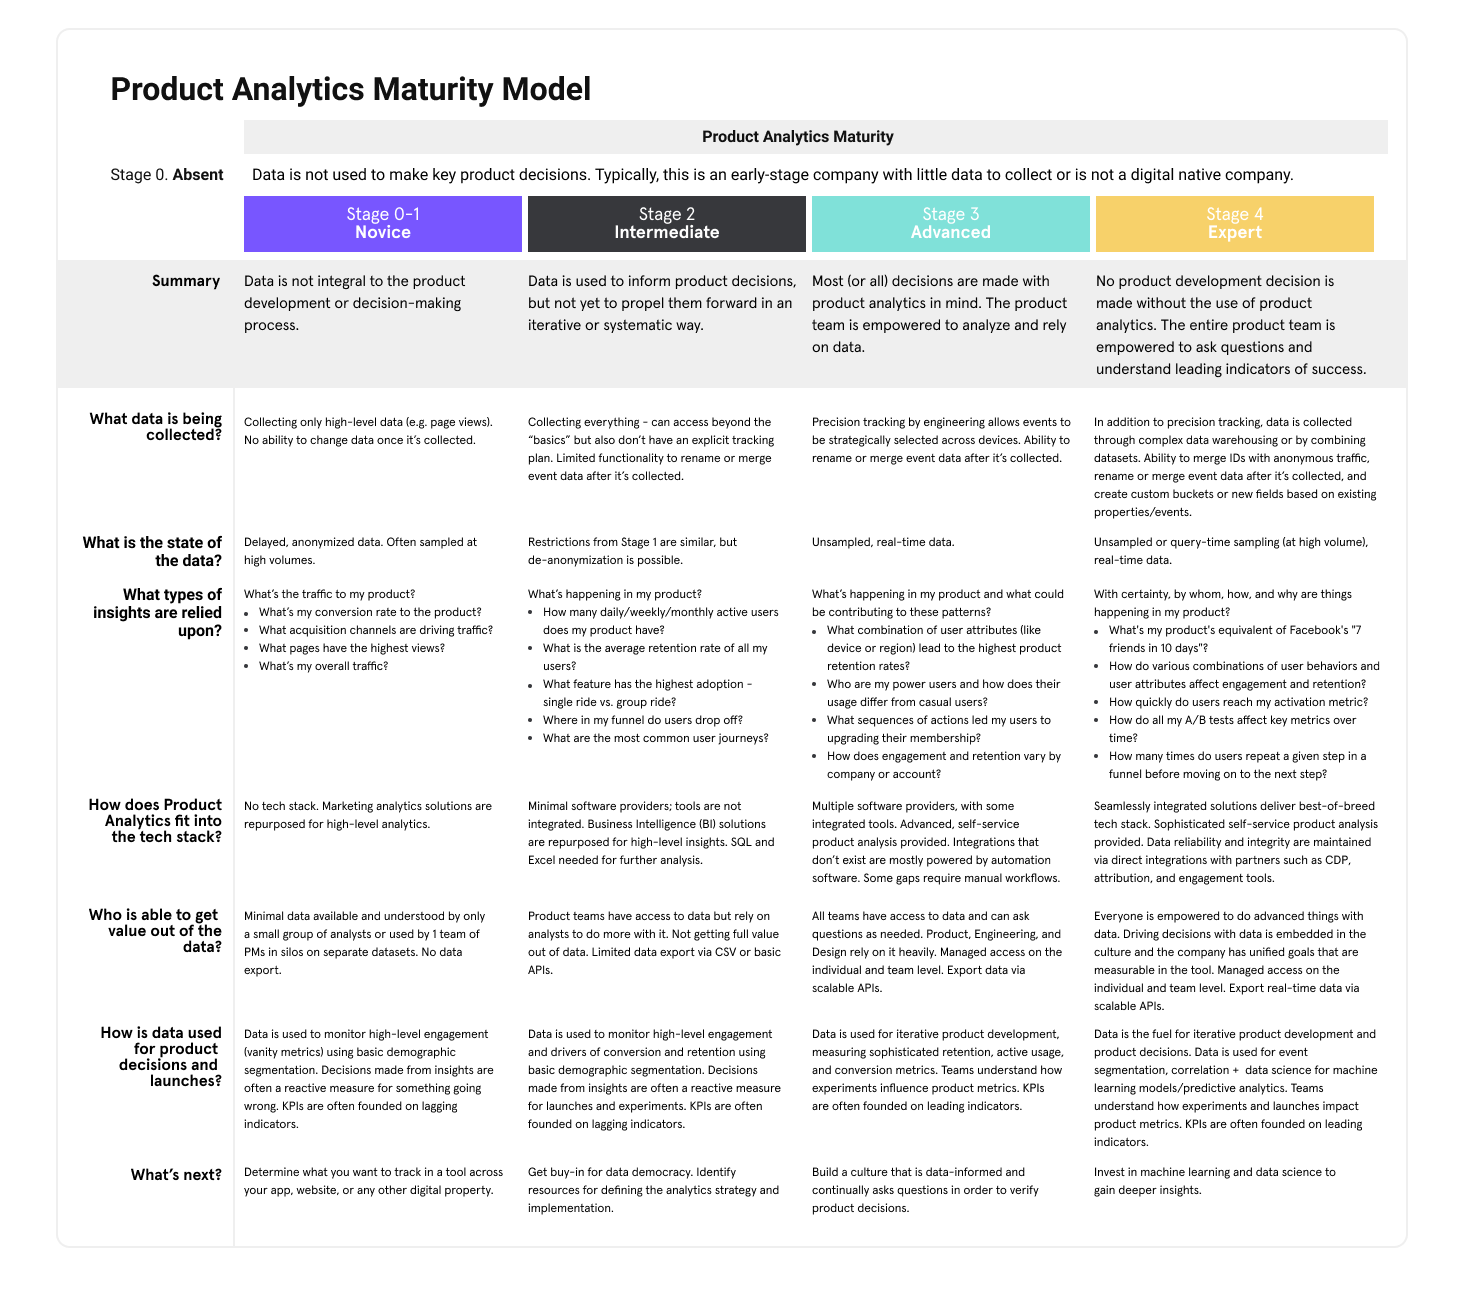
There are five separate levels in our product maturity analytics model—ranging from non-existent to expert. Businesses that fall within the same stages have shared characteristics, limits to the questions they can or can’t answer, and the ability to derive value out of their data.
Product analytics maturity matters because it can help you:
Build the right things
Keep users engaged and happy by improving all aspects of your product experience. Use data to optimize onboarding flows, re-engage inactive user groups, and identify the behaviors that define power users. You can continue to track improvement as your user base and product experience change and grow.
Empower teams to move faster
Keep up with customer expectations by constantly learning and improving your products. Use real-time user insights and experience testing to rapidly identify what works, and where you should invest further.
Move the metrics that matter to your business
Identify KPIs at the leadership level, enable each team to impact key metrics, and measure how they change in real-time.
Integrating product analytics into your organization’s workflows means everyone can use data to be more strategic.
Learn about your product analytics maturity stage
Jump to the section that best represents your level of product analytics maturity:
Where do you stand?
Use this matrix as a guide to understand the characteristics of your product analytics strategy at each stage, and what’s needed to progress.
Get PDF