The struggle to be data-driven

The feature factory problem
For decades, organizations have chased the goal of being “data-driven.” Yet despite huge investments and leaps in technology, how many really are? Too often, decisions are still based on gut instinct or metrics chosen to confirm a preferred story. In that environment, releasing features becomes the default signal of progress: Teams are rewarded for speed and delivery, while the harder question—”Did any of this create value?”—goes unanswered.
The data is sobering. Across large product orgs, only about 10–30% of ideas end up delivering a measurable business impact when tested. The rest are neutral or negative. Most shipped features add cost, complexity, and ongoing maintenance without moving the outcomes that matter, creating a hidden tax on future execution and usability.
As product thinkers like John Cutler and Itamer Gilad have noted, this pattern reflects a “feature factory” culture, where output becomes the measure of success, even when it isn’t tied to real impact. Teams caught in this cycle mistake activity for progress, shipping features faster but learning slower.
To escape, organizations must shift their mindset from a feature factory to a value generator: one that defines progress by outcomes achieved, not by the volume of launches.
However, escaping the feature factory isn’t just a mindset shift; it’s a systems problem. Despite years of effort to move from outputs to outcomes, most organizations are still trapped by the deeper structural forces that disconnect work from impact.
References
Moving from Feature Factories to Value Generators by Itamar Gilad
12 Signs You're Working in a Feature Factory by John Cutler
65
%
of projects fail to create measurable results
10-30
%
of ideas deliver measurable positive impact
Messy Middle

Are we actually making an impact?
KPIs
Lagging Success Metrics
The “messy middle” is the root cause of the struggle
Every company ultimately wants to move its business KPIs: the long-term health measures like revenue, customer growth, and retention that show whether the business is thriving. These numbers are essential, but they share a common limitation: they are lag measures. As the authors of The 4 Disciplines of Execution put it, lag measures are like checking the scoreboard after the game is already over. They tell you the outcome, only after it’s too late to do anything.
Meanwhile, day-to-day work happens at a different tempo. Teams ship features, run campaigns, and design experiments that may nudge local metrics such as clicks, signups, or conversion rates. Yet the connection between those local improvements and the company’s top-line KPIs is often unclear.
This disconnect creates what many organizations experience as the “messy middle”: a gap between everyday activity and the outcomes that matter most. Leaders are left uncertain about which bets truly drive growth, while teams feel powerless to influence the numbers that define success.
References
The 4 Disciplines of Execution by Chris McChesney, Sean Covey, and Jim Huling

Executives & Leaders
Problems
Revenue is flattening, but the root cause is unclear
Dashboards show what happened, not why
Consequences
Feel blind and deflated
Uncertainty spreads as teams can’t see how to make a real difference

Product Managers
Problems
Flooded with feature requests
Lacking a data-driven framework for prioritization
No clear map of which metrics truly drive impact
Consequences
Feel stuck in opinion battles and politics
Confidence erodes as prioritization feels arbitrary

Teams
Problems
Can’t trace how their work connects to outcomes or customer value
Strategy and daily reality drift apart
Consequences
Feel a growing dissonance and loss of purpose
Morale drops as faith in leadership and direction fades
Even well disciplined “data-driven” teams aren’t immune.
Let’s look at an example. A marketplace I worked with once set an OKR to increase average services per seller. The team hit its target—services per seller rose 39%—and celebrated. But soon after, seller retention fell 6% after low-engagement services flooded the marketplace.
By optimizing a local metric in isolation, they incentivized behavior that actually hurt the business. They had the data, the dashboards, and the OKRs—but without a model connecting initiatives to business value, they mistook movement for progress. Consequently, they invested millions in an initiative that actually hurt their business.
Initiative
Grow services
per seller
$
2M
per year
Metric
Average services per seller
39
%
Result
Seller retention rate
6
%
Introducing value architecture
Models that connect work to value
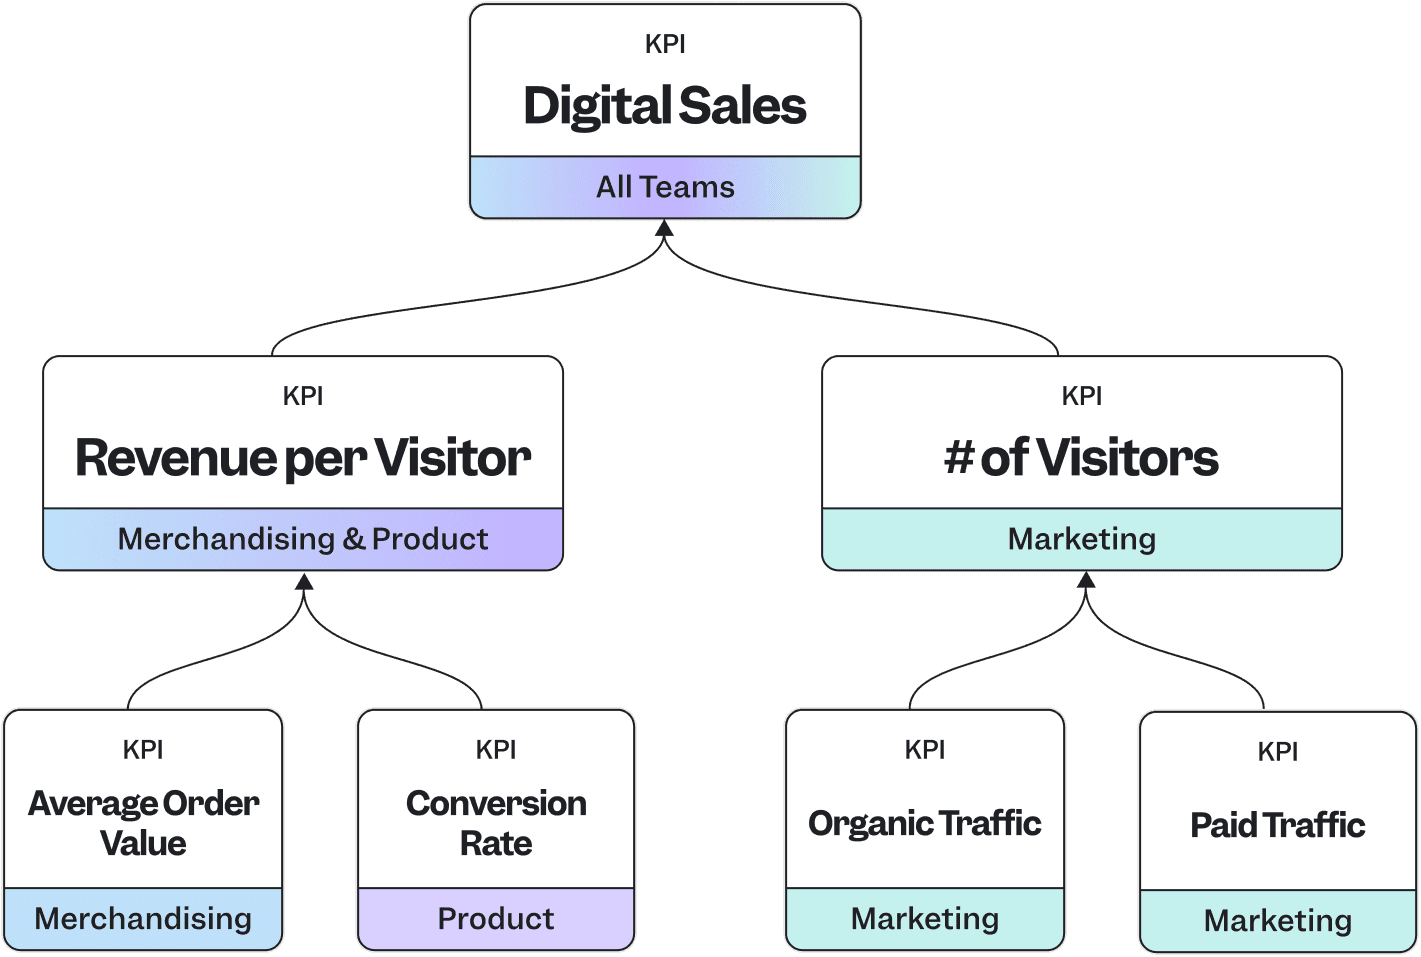
Value architecture is the solution to this messy middle problem. With value architecture, organizations can create a shared model for how work creates results. More than any other format for analyzing data, value architecture helps you translate value from bottom-level inputs like clickstream data to top-level KPIs.
A value architecture starts with the projects, initiatives, features, or campaigns your teams are building. It ties those to the input metrics they can directly influence—the behaviors, adoption patterns, or operational drivers that show whether the work is having its intended effect. From there, it connects those inputs to the business value they create and, ultimately, the lagging KPIs that measure long-term success, like revenue, retention, and customer growth.
Work
Projects
Initiatives
Features
Value Architecture
Inputs
Business Value
KPIs
Lagging Success Metrics
A value architecture is more than a diagram; it’s a new way of thinking that reshapes how strategy, data, and execution come together. It matters because:
It makes assumptions explicit so they can be tested, refined, or challenged.
It gives leaders visibility into which levers really drive growth and which bets are paying off.
It helps teams see why their work matters and how it contributes to the bigger picture.
It provides a shared language so priorities stop clashing and decisions can be made with confidence.
A value architecture is durable. Roadmaps expire, dashboards update, and OKRs reset every quarter. But a value architecture evolves since it’s a model you can continually sharpen as you learn. Over time, it becomes a system that outlives the lifespan of any one plan, campaign, or roadmap, and keeps the organization aligned around how value is truly created.
References
Persistent Models vs. Point-In-Time Goals by John Cutler
The pattern behind top-performing companies
Though they may not call it value architecture specifically, top-performing companies have used it in one form or another for years.
Different companies use different languages. Some talk about input metrics. Others have growth models, KPI trees, or rely on North Star frameworks. The terminology varies, but the underlying idea is the same: The best companies have a clear model that connects everyday work to the business outcomes that matter.
Let’s look at a few examples of how this pattern shows up in practice — expressed in different ways, but always built on the same foundation.

See how Netflix improved retention using value architecture

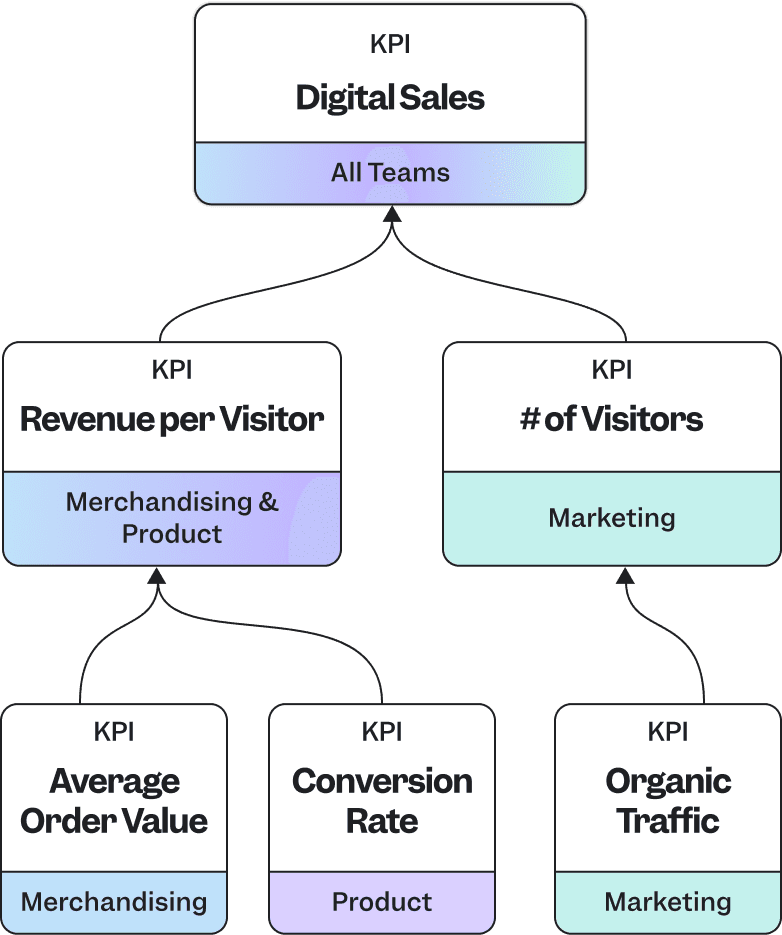
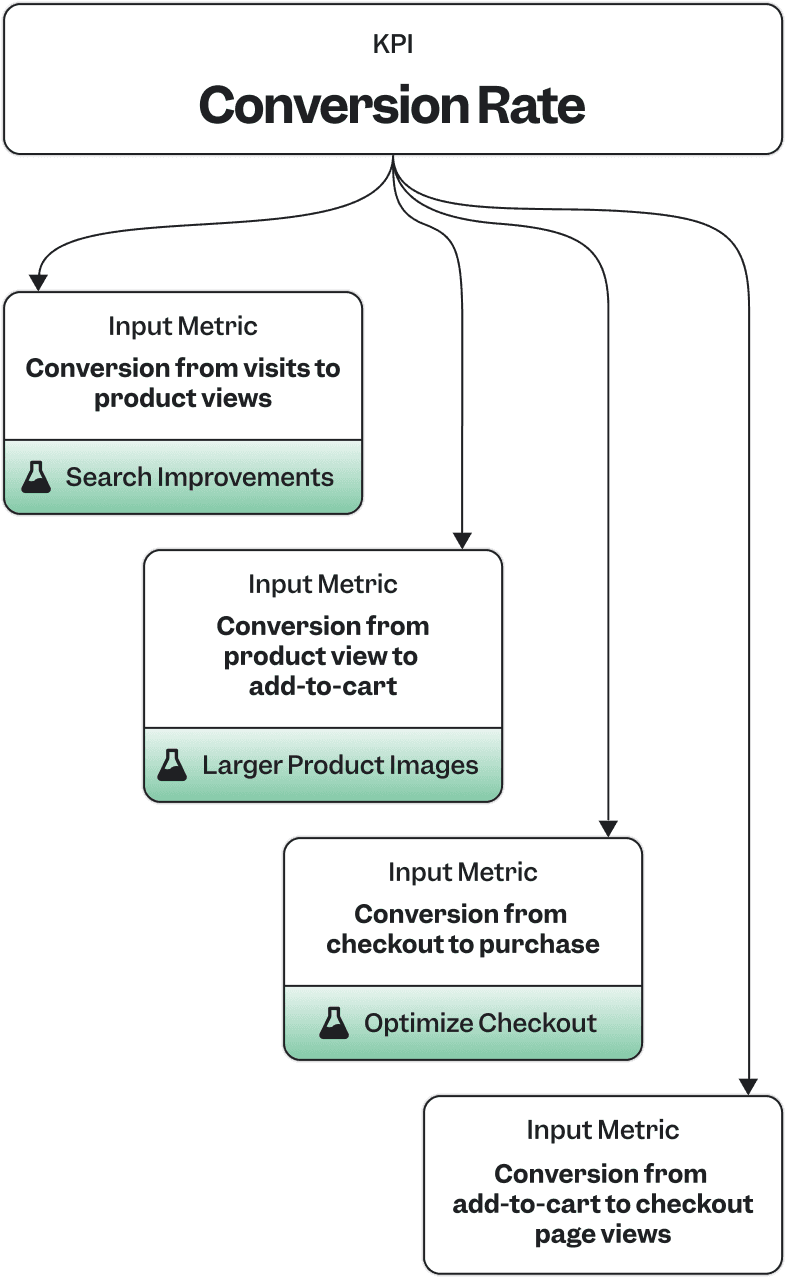
Read about how Amazon used value architecture to drive sales

Learn how Duolingo identified movable metrics with value architecture
How SaaS companies use value architecture to grow ARR
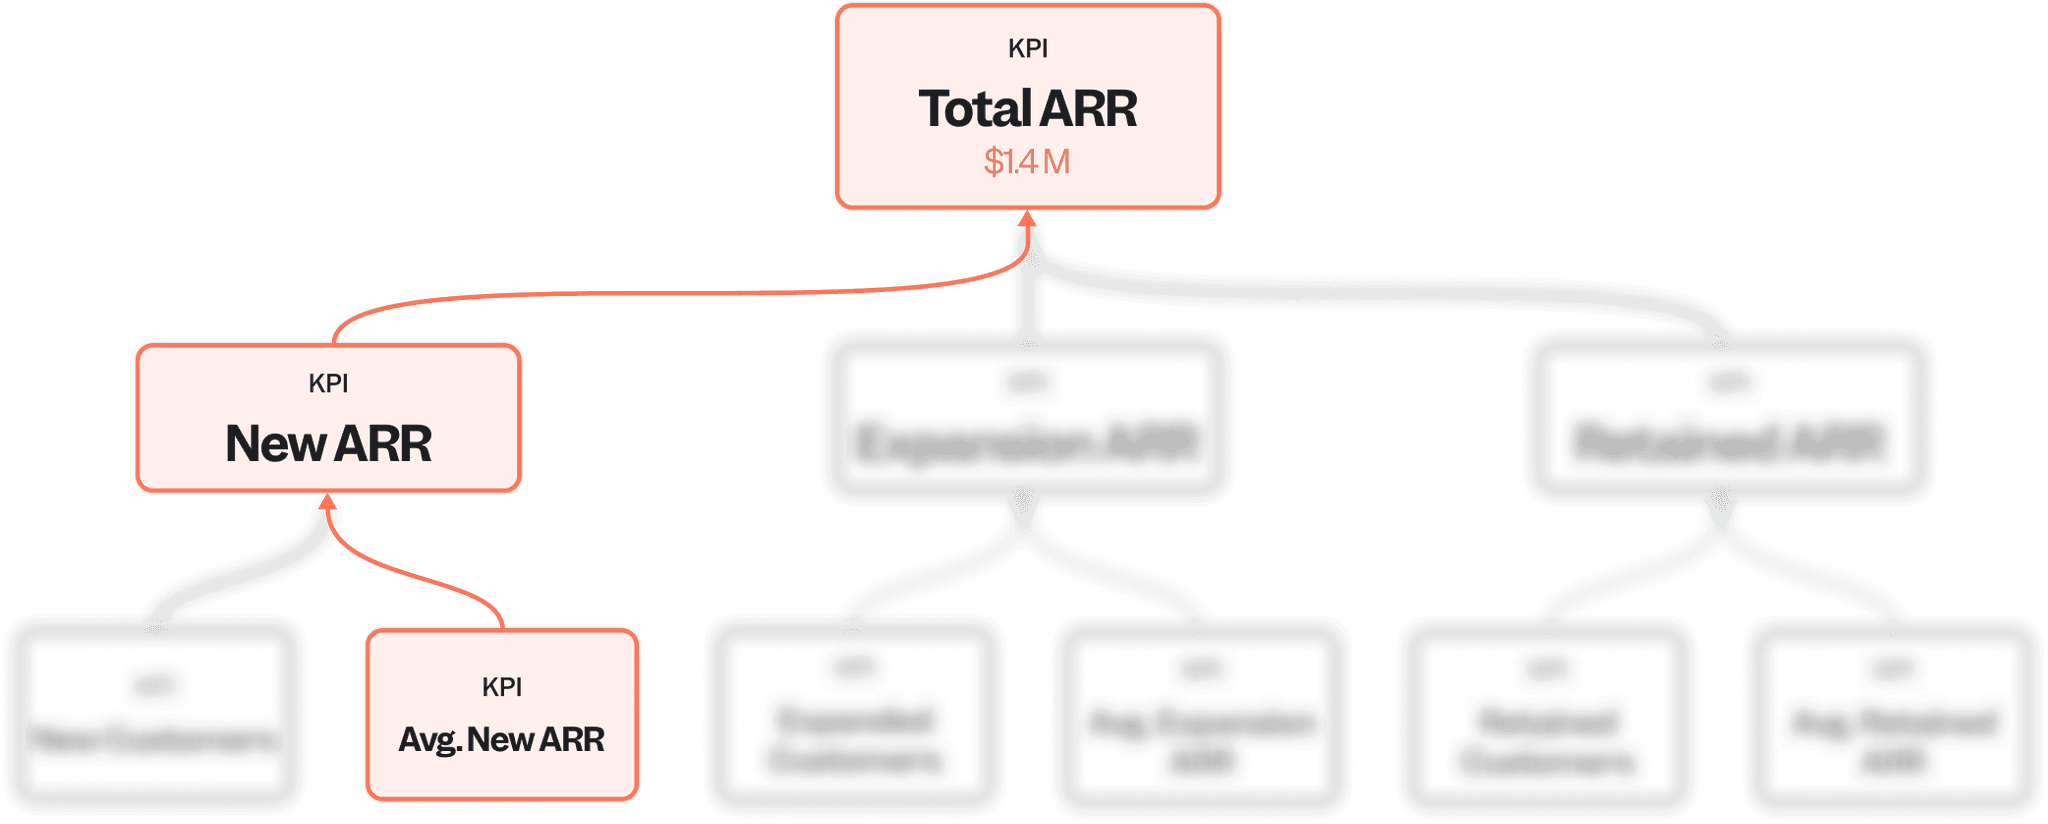
For SaaS companies, annual recurring revenue (ARR) is the ultimate outcome—but it’s also a lagging KPI, shaped by many upstream factors across product, sales, marketing, and customer success. Metric trees—a form of value architecture—help by breaking ARR into its component drivers, exposing the levers that truly move the business.
Negative Impact
Positive Impact
In this example, total ARR is composed of new, expansion, and retained ARR—each driven by its own set of measurable inputs such as new customers, upgrades, and renewals. Mapping these relationships makes it clear how different parts of the business interact: Growth in one area can be offset by churn in another, and small changes in inputs can compound into meaningful shifts in total ARR.
This structure is powerful because it’s mathematical: ARR can be expressed through clear relationships among new customers, expansion, and retention. Those relationships are still complex and interdependent, but mapping them explicitly makes the system intelligible. It doesn’t eliminate the hard trade-offs but instead makes them visible, enabling sharper reasoning, alignment, and prioritization.
References
Introducing Metric Trees by Trevor Fox and Abhi Sivasailam
Putting value architecture to work
Most organizations pursue alignment at the surface level—agreeing on goals, OKRs, or roadmaps—without first agreeing on how the business actually works. The result is fragile alignment: Teams may move in the same direction for a quarter, but their assumptions about cause and effect diverge underneath. When reality shifts, those assumptions break, and the strategy unravels.
Value architecture replaces that superficial alignment with structural alignment. It flips the traditional sequence to one that starts with a shared model of what drives results: Value Architecture → Metrics → Goals → Work. When everyone begins with the same understanding of cause and effect, coordination becomes durable. As new information emerges, the model evolves, keeping strategy coherent even as priorities change.
Let’s look at how value architecture changes how leaders align teams—and how teams place their bets.
Leaders align teams on the right problems
At the leadership level, the job shouldn’t be to prescribe projects but to clarify the most important problems. As Marty Cagan notes in his product operating model, leaders should define the what and why, while teams determine the how. Spotify’s idea of aligned autonomy captures the same balance: direction through clarity, innovation through freedom.
Value architecture makes operating models of aligned autonomy practical. Instead of managing from initiative lists, leaders create a shared model of how the business works, showing which levers matter most and how they connect to outcomes. Each team owns a metric they can directly influence, while understanding how their work contributes to higher-level results. It ensures every team knows both their lane of ownership and how their work fits into the broader system.
References
Aligned Autonomy at Scale (from Spotify Model) by Roland Flemm
Transformed: Moving to the Product Operating Model by Marty Cagan

Teams translate strategy into action
While leaders use value architecture to clarify goals, teams use value architecture to focus their bets. By seeing which levers truly drive outcomes, they can design experiments and initiatives that target the right inputs—not just what’s visible or easy to move. This turns ideation and prioritization into an informed process rather than guesswork or politics.
Value architecture also gives teams a shared language with leadership. Instead of reporting a scatter of local metrics, they can show how their work influences the broader system—at an altitude that helps executives see impact without losing the nuance of what’s happening on the ground.
Together, these shifts replace noise with clarity. Leaders can steer with confidence, and teams can pursue innovation with purpose—each side seeing how their decisions compound into measurable progress.
Data-connected metric trees
Why value architecture has been inaccessible until now
Value architecture isn’t new— as we’ve seen, the world’s best operators have practiced it for years. So why haven’t more companies adopted it?
Traditionally, this level of rigor comes at a steep cost. Companies like Amazon can afford to devote huge amounts of leadership attention, analyst capacity, and operating discipline. In other words, brute force.
For everyone else, value architecture has remained out of reach: too fragmented to maintain in flowcharts and spreadsheets, too analyst-heavy to scale, and too fragile to survive the pace of modern business.
Why data-connected metric trees are the answer
What only the best companies could once achieve is now becoming accessible to all with a new medium: data-connected metric trees.
A data-connected metric tree is a model that combines two things in one place:
1
The structure of a value architecture: a visual map showing how inputs ladder up to outcomes
2
Live data flowing through it: so every metric in the map updates dynamically with real numbers.
This combination transforms a static strategy artifact into a living system. Instead of sketching a metric tree in one tool and then hunting down numbers in another, teams can see both the relationships and the current performance in a single, unified view.
The benefits are profound:
Accessibility
No longer confined to analysts or finance experts, anyone on a team can engage with the model, understand the levers, and see how their work fits into the whole.
Durability
The model stays current, because the metrics are fed directly by data sources. No more fragile spreadsheets that go stale the moment they’re updated.
Focus
Leaders and teams can spot which levers are actually moving, scrutinize whether they connect to outcomes as expected, and direct attention where it matters most.
Data-connected metric trees make what once required Amazon-level discipline achievable for more organizations. Operationalizing a value architecture still relies on strong partnership between data, product, and business functions, but that rigor is now embedded in a system that’s lighter, faster, and more continuous than the manual, analyst-heavy processes it replaces.

From brute force to data-connected metric trees
How metric trees evolve in practice
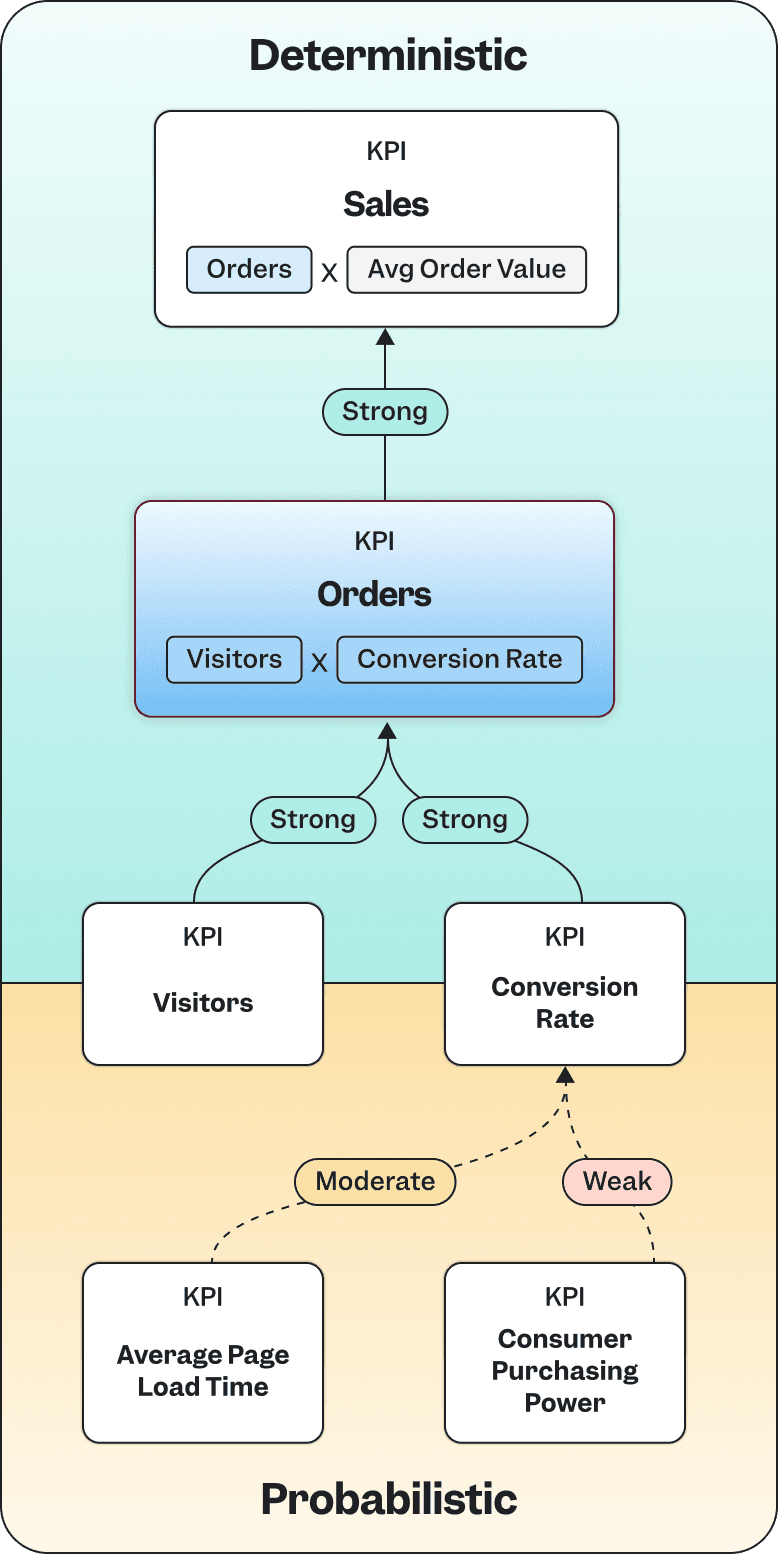
Not all metric trees operate on the same kind of logic. Some reflect certainty, others learning. Both are essential to a healthy value architecture.
Deterministic metric trees are built on fixed mathematical relationships. Each parent metric is the precise calculation of its children—like Revenue = Users × Average Revenue per User. These structures are invaluable in well-understood domains. They enable forecasting, root-cause analysis, and precise simulation of what happens when one lever moves. Deterministic trees make it possible to quantify trade-offs and align teams around objective, measurable drivers of growth
Probabilistic (or hypothesis) metric trees deal in influence rather than certainty. Their connections are grounded in evidence-based hypotheses—for example, that improving onboarding completion rate will increase week-1 retention. These trees are essential in emerging areas where cause and effect are still being discovered. They provide a structured way to test assumptions, evaluate new levers, and quantify confidence as evidence accumulates

The most effective organizations use both. A mature value architecture blends the two: stable, deterministic branches for proven drivers and exploratory, probabilistic branches for new bets. Over time, validated hypotheses “harden” into deterministic links, and the architecture becomes a living record of what the company knows, what it’s testing, and how fast it’s learning
This combination opens powerful new capabilities. Deterministic branches support forecasting, accountability, and confidence in decision-making. Probabilistic branches fuel discovery and innovation. Together, they create a system that not only describes the business but helps it evolve—bridging the gap between operational precision and strategic curiosity.
A timeless problem—but the time to invest is now
The messy middle has existed from the beginning of the digital revolution, but with AI the reasons for investing in a value architecture are compounding.
The problem is growing
AI has accelerated the very problem value architecture was designed to solve. It’s now easier than ever to build and ship new features, but that same speed can amplify the feature factory trap—optimizing what’s easy to move rather than what truly matters.
The stakes are higher for AI-driven initiatives in particular: Developing and deploying AI features consumes substantial compute, data, and engineering resources, and when those efforts miss the mark, the waste compounds quickly. The result is an environment where teams can deliver faster than ever, but misalignment between work and outcomes has never been more costly in its consequences.
More feasible than ever
At the same time, AI is making value architecture easier to build and maintain. New systems can synthesize business context across documents, data sources, and product telemetry to infer relationships between metrics and identify the inputs that drive outcomes.
What once required months of manual analysis and analyst intervention can now be accelerated by AI—helping teams draft, refine, and evolve metric trees that reflect how their business actually works. These advances don’t eliminate the need for human judgment; they amplify it, providing the scaffolding for faster alignment and more intelligent experimentation.
The benefits have multiplied
As AI becomes embedded in how organizations operate, the importance of strategic context increases. Metric trees provide that context in a form that both humans and AI systems can understand. They act as a translation layer between data and intent, ensuring that the next generation of AI agents—whether building products, running experiments, or optimizing campaigns—stay grounded in business outcomes rather than vanity metrics.
In a future defined by autonomous systems, value architecture becomes the guardrail that keeps speed aligned with strategy.