Template
Template
Ecommerce Analytics Template
Ecommerce Analytics Template
Ecommerce Analytics Template
Track revenue, analyze purchases, optimize conversions, and identify your best acquisition channels.
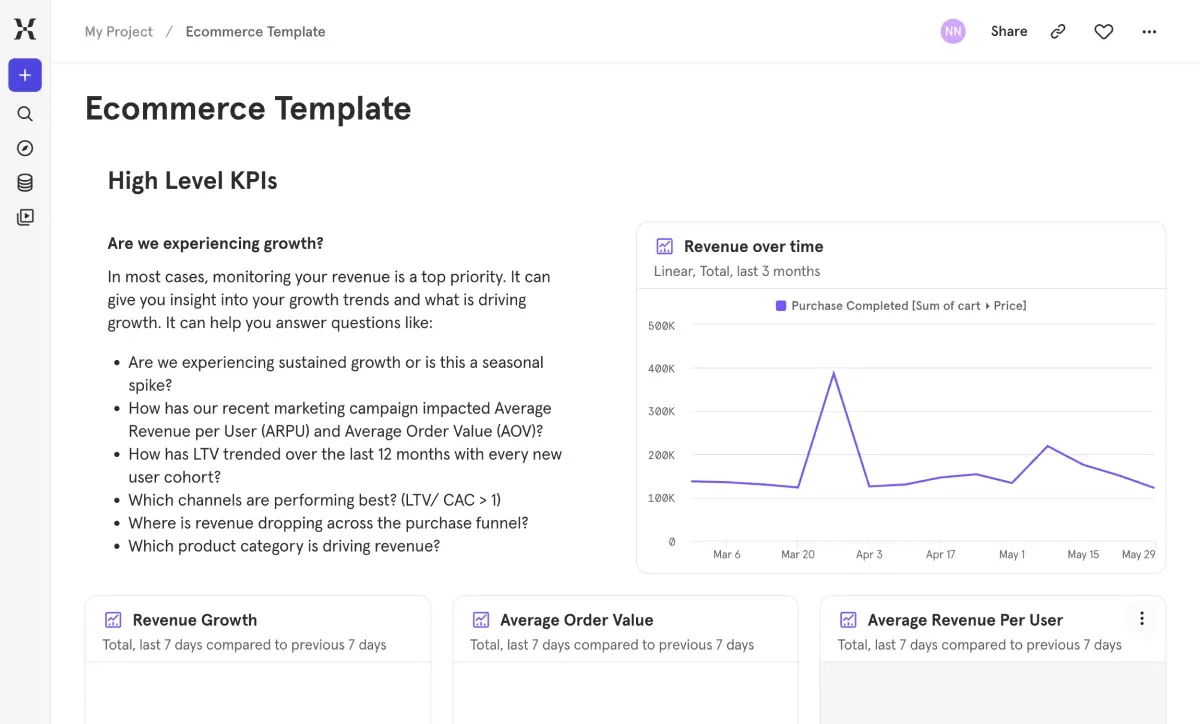
Revenue is growing, but do you know why — and where the next opportunity is? This template helps e-commerce teams go beyond top-line revenue to understand what customers are buying, where they drop off before purchasing, and which acquisition channels bring the most valuable buyers.
Find the friction points in your checkout flow, see whether growth is coming from new customers or repeat purchasers, and identify which channels drive buyers who actually come back. Stop guessing which part of the funnel to optimize and let the data tell you. It's the difference between reporting on revenue and actually understanding your business.
Pertanyaan yang Sering Diajukan
What analytics should I track for my e-commerce store?
Start with the basics: revenue trends, who’s buying, and whether they come back. From there, you want to understand purchase behavior (what are people buying and how often), where your funnel leaks (cart abandonment, checkout drop-off), and which acquisition channels bring customers who actually stick around. This template covers all four areas so you’re not stitching together reports from five different tools.
How do I find where customers drop off in my purchase funnel?
The template includes a multi-step purchase funnel that shows conversion rates between each stage — product view, add to cart, checkout, purchase. You can see exactly where the biggest drop-offs happen. A user flow report then shows what people do instead of converting at each step, which is often more revealing than the drop-off numbers alone. Pair that with the time-to-purchase data and you’ll know both where and when friction is costing you sales.
How do I measure which marketing channels drive the most valuable customers?
Volume isn’t the whole story — you need to know whether those customers stick around. The acquisition section shows top channels by new customer count and conversion rate, but the real insight is in the purchase retention report. It shows whether customers from each channel come back to buy again. A channel that drives tons of first-time buyers who never return might be less valuable than a smaller channel with loyal repeat customers.
How do I measure time to purchase for my online store?
This template includes a time-to-purchase distribution that breaks down conversion windows — what percentage of purchases happen within minutes, hours, or days. It helps you set realistic remarketing windows and understand whether your purchase cycle is getting shorter or longer over time. If most conversions happen within 24 hours but your retargeting campaigns run for two weeks, that’s useful information.
What is a good e-commerce funnel conversion rate?
E-commerce funnels typically convert between 1–5% end-to-end, but the absolute number matters less than knowing where your biggest drop-offs are. This template breaks down conversion between each step — product view, add to cart, checkout start, purchase — so you can focus optimization on the stage that’s costing you the most. Improving a 40% drop-off at checkout will do a lot more for revenue than squeezing another percent out of the top of funnel.
How do I track revenue by product or brand in Mixpanel?
As long as your purchase events include product or brand metadata, the revenue-by-brand breakdown populates automatically. You can click into any brand to see detailed trends and compare performance across your catalog. If your data is already flowing into Mixpanel with those properties, you’ll have this view up and running in minutes.
More templates


Bangun dengan cepat. Kirim dengan lebih cerdas. Ketahui apa yang berhasil dan mengapa.
Bangun dengan cepat. Kirim dengan lebih cerdas. Ketahui apa yang berhasil dan mengapa.
Bangun dengan cepat. Kirim dengan lebih cerdas. Ketahui apa yang berhasil dan mengapa.