Template
Template
Company KPIs Template
Company KPIs Template
Company KPIs Template
Measure product health across engagement, retention, and growth in one unified dashboard.
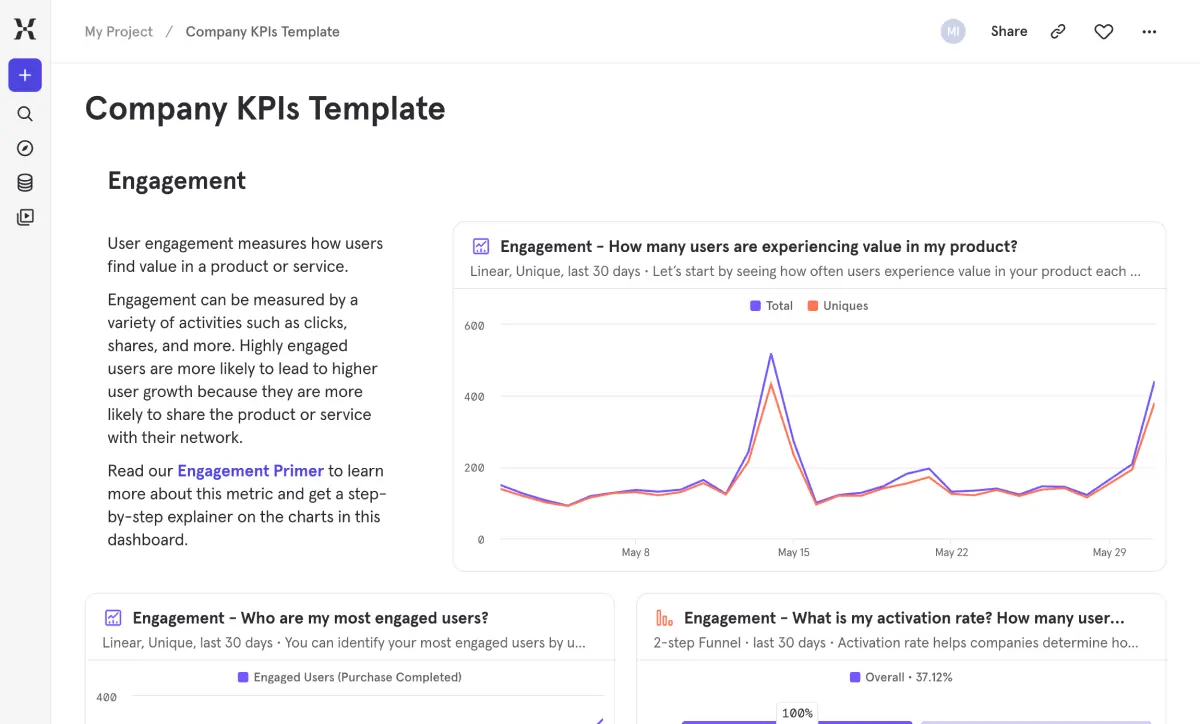
Is your product actually healthy, or are you just looking at the numbers that feel good? This template helps you answer the three questions every product team needs to align on: are users finding value, are they coming back, and is the user base growing?
Instead of cobbling together one-off reports, you get a single dashboard that connects engagement to retention to growth. Spot problems early — like strong signup numbers masking a retention decline — before they show up in revenue. It's the dashboard you'll reference in every team standup, board meeting, and planning cycle.
Pertanyaan yang Sering Diajukan
What company KPIs should I track in a product analytics tool?
Focus on the three things that tell you whether your product is actually working: engagement (are users finding value?), retention (are they coming back?), and growth (is the user base expanding?). This template tracks all three — daily active users experiencing value, activation rate, most engaged cohorts, dormant user trends, retention curves, DAU/WAU, new signups, and channel-level acquisition. Together they give you one place to check instead of five.
How do I measure product engagement and retention together?
They’re two sides of the same coin — highly engaged users tend to retain better, and poor retention is often an engagement problem in disguise. This template puts them side by side so you can see the connection directly. The engagement reports show who’s reaching your value moment and how active your best cohorts are. The retention reports show whether those users stick around or quietly disappear. Viewing both together helps you spot when engagement gains aren’t translating into lasting retention.
What's the best way to track whether my product is growing?
Look at growth from multiple angles — not just signups, but whether new users are sticking around and whether your existing base is staying active. This template shows acquisition trends alongside retention curves and dormant user counts, so you can see the full picture. Healthy growth shows up as a stable or expanding retained user base, not just a bigger top-of-funnel number.
How do I track my activation rate?
Activation rate tells you how quickly new users reach your product’s value moment — say, completing a purchase or finishing onboarding. This template includes a two-step funnel that calculates it automatically and tracks the trend over time. You can swap in whatever steps match your specific value moment, so it works whether activation means creating a project, inviting a teammate, or making a first transaction.
More templates




Bangun dengan cepat. Kirim dengan lebih cerdas. Ketahui apa yang berhasil dan mengapa.
Bangun dengan cepat. Kirim dengan lebih cerdas. Ketahui apa yang berhasil dan mengapa.
Bangun dengan cepat. Kirim dengan lebih cerdas. Ketahui apa yang berhasil dan mengapa.