Mixpanel vs. Adobe Analytics
Mixpanel vs. Adobe Analytics
Adobe requires heavy setup and specialty support, slowing teams down. Mixpanel delivers fast, intuitive, self-serve analytics that empower teams to act on insights—no need for multiple add-ons/products, no data engineering, no waiting.
Adobe requires heavy setup and specialty support, slowing teams down. Mixpanel delivers fast, intuitive, self-serve analytics that empower teams to act on insights—no need for multiple add-ons/products, no data engineering, no waiting.
See every user action instantly
See every user action instantly
Mixpanel delivers detailed insights into user behavior, funnels, and cohorts, empowering out-of-the-box intelligence.
Mixpanel delivers detailed insights into user behavior, funnels, and cohorts, empowering out-of-the-box intelligence.
Start faster, act smarter
Start faster, act smarter
Mixpanel’s quick implementation lets you spend time driving insights, not configuring tools.
Mixpanel’s quick implementation lets you spend time driving insights, not configuring tools.
Find self-serve answers
Find self-serve answers
Mixpanel makes exploration, funnels, and cohorts simple for everyone—from product analysts to business leaders.
Mixpanel makes exploration, funnels, and cohorts simple for everyone—from product analysts to business leaders.
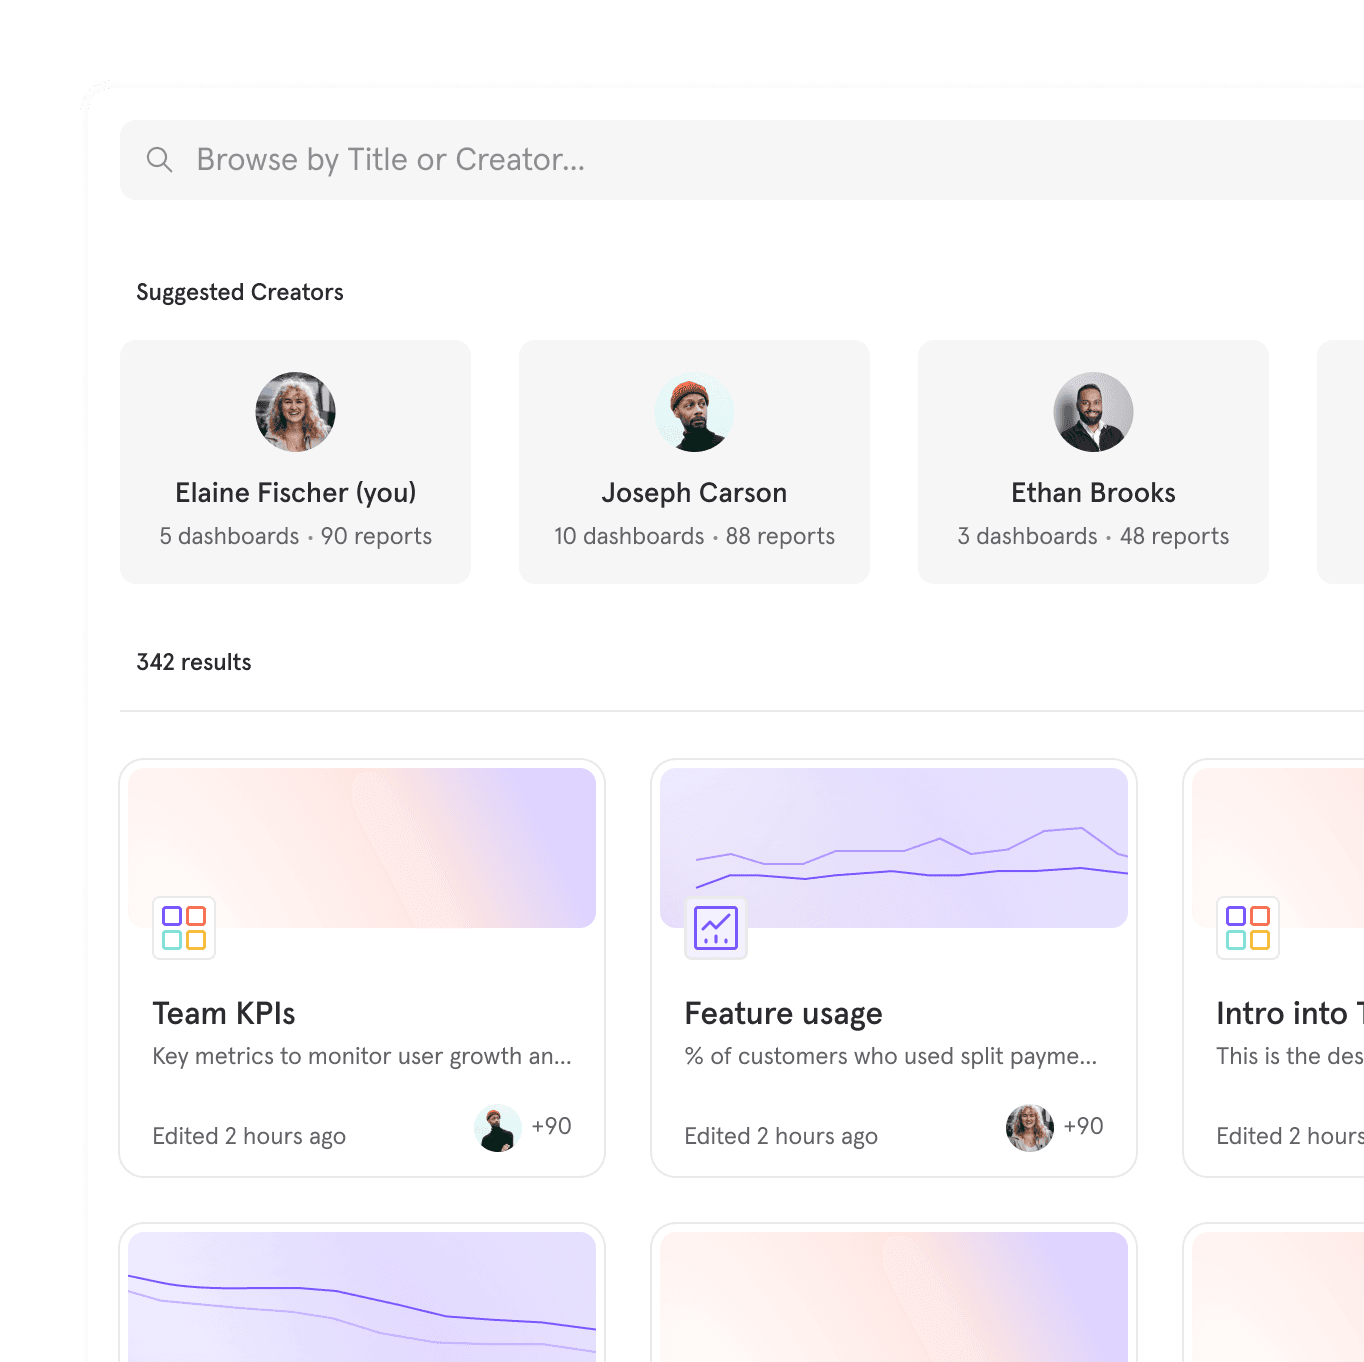
Empower teams with self-serve analytics
Don’t let data bottlenecks slow your team down. With Mixpanel, every team member—Product, Marketers, or Executives—can access, explore, and analyze data independently.
Answer questions fast: Explore data and create reports in minutes without waiting on data teams.
Collaborate effortlessly: Share dashboards and insights across teams so everyone stays aligned around the same clear metrics.
Instant insights, zero barriers: Simple yet powerful analytics empower everyone to make data-driven decision — no extensive data queries required.

Act faster with real-time insights
In today’s fast-paced environment, waiting for reports isn’t an option. Mixpanel delivers live, actionable data instantly, so you can take action as trends emerge.
Live event tracking: See what users are doing in real time to identify opportunities and resolve issues immediately.
Lightning-fast queries: Get answers to complex questions in seconds, not hours, with AI.
Proactive alerts: Stay ahead of trends with customizable notifications for key metric changes.
Simplify implementation and scale seamlessly
Mixpanel gets you up and running quickly— no additional products or Adobe Experience Platform setup required. Focus on driving value, not on configuring a complex analytics platform.
Fast setup: Start tracking insights immediately with minimal setup and no heavy lifting.
Integrates with your stack: Connect seamlessly to your existing tools and data sources for a streamlined workflow.
Built for growth: Mixpanel scales effortlessly to support your needs, whether you’re analyzing thousands or billions of events.
Mixpanel vs. Adobe Analytics
All-in-one solution, no additional products
Customizable Dashboards
Real-Time Insights
Custom Alerts and Notifications
Self-Serve Analytics
Collaboration Tools
Unlimited Funnel Steps
Instant setup with autocapture
Metric Trees
Session Replay
기능
Mixpanel vs. Adobe Analytics
All-in-one solution, no additional products
Customizable Dashboards
Real-Time Insights
Custom Alerts and Notifications
Self-Serve Analytics
Collaboration Tools
Unlimited Funnel Steps
Instant setup with autocapture
Metric Trees
Session Replay
기능
Real-Time Insights
Custom Alerts and Notifications
Self-Serve Analytics
Collaboration Tools
Unlimited Funnel Steps
Instant setup with autocapture
Metric Trees
Session Replay
Customizable Dashboards
All-in-one solution, no additional products
Mixpanel vs. Adobe Analytics
All-in-one solution, no additional products
Customizable Dashboards
Real-Time Insights
Custom Alerts and Notifications
Self-Serve Analytics
Collaboration Tools
Unlimited Funnel Steps
Instant setup with autocapture
Metric Trees
Session Replay
기능
See why top companies rely on Mixpanel for growth
See why top companies rely on Mixpanel for growth
“Recently tried Mixpanel & Google Analytics on the same app & Mixpanel UX just blows every other option out of the water.”
Rakesh G
Founder at Snipply
“Remember that feeling when you switched from a Nokia brick phone to a smartphone with a touchscreen? I’m getting that same feeling when I switched from Firebase + Google Analytics to Mixpanel”
Richard W
Founder at Tensor
“Mixpanel has proven to be a very useful tool both for our UX, product, and marketing teams and has allowed us to gain additional insights into how our players navigate the platform”
Scuri M
Director of Operations at FACEIT