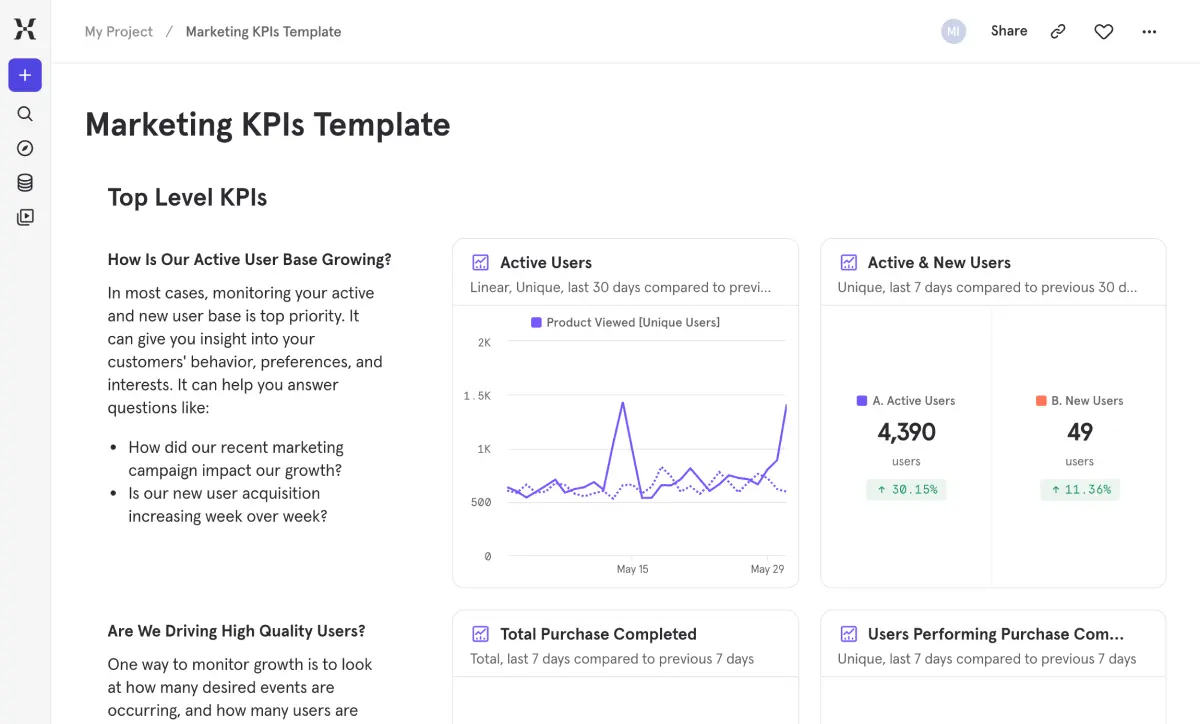
Marketing teams often know what they're spending but struggle to connect that spend to what actually matters: engaged users and revenue. This template closes that gap by tying acquisition channels to downstream behavior — not just clicks and signups, but session engagement, conversion, and retention.
Quickly answer whether a campaign brought quality traffic or just volume, and see how long it takes new visitors to convert. Identify which channels produce users who stick around versus those who bounce after one visit. It's the shared dashboard that aligns your marketing team around outcomes instead of vanity metrics.
자주 묻는 질문
What marketing KPIs should I track in a product analytics tool?
Cover the full funnel: acquisition (new users by channel, conversion rates), engagement (active users, session duration, bounce rate, pages per session), and conversion (first-visit conversion rate, time to first purchase). This template organizes all of them from the top-level overview down to channel and session detail, so you can see both the big picture and where to zoom in.
How do I measure the quality of traffic from different marketing channels?
Look at what people do after they arrive, not just that they showed up. This template tracks users from channel through engagement metrics (bounce rate, session depth, top events) to conversion (first-visit conversion, time to purchase). A retention curve for each channel shows which ones produce users who keep coming back. That’s the real measure of quality — not clicks, not even signups, but lasting engagement.
How do I connect marketing spend to conversion outcomes?
The Ad Spend section lets you track cost per click and total spend right alongside your conversion data. When you can see acquisition cost next to first-visit conversion rates, time to first purchase, and retention by channel, the ROI math gets a lot clearer. It takes the guesswork out of budget allocation and gives you something concrete to point to when someone asks why you’re shifting spend.
How do I measure first-visit conversion rate?
First-visit conversion rate tracks the percentage of users who complete a desired action during their very first session. This template calculates it and pairs it with median time to first conversion, so you see both how many visitors convert immediately and how long it takes the rest. Together they tell you whether your landing experience is doing its job or leaving opportunity on the table.
What web analytics metrics should marketers track beyond pageviews?
Pageviews tell you volume, but not much else. This template goes further with session engagement (bounce rate, duration, top events), user-level metrics (active users, new users, geography, platform), and conversion data (first-visit conversion, time to purchase, pre-purchase user flows). The difference between knowing you got 50,000 pageviews and knowing those visitors engaged deeply, converted, and came back — that’s what separates reporting from insight.