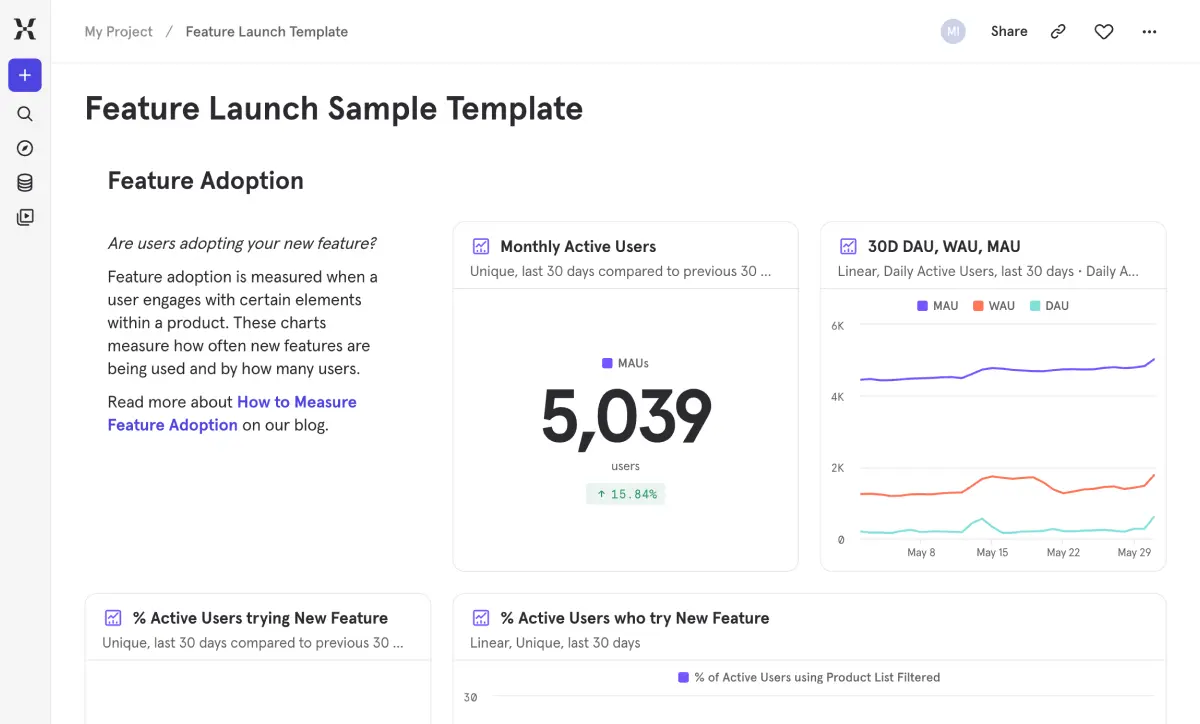
You shipped the feature — now what? The hardest part of any launch isn't building it, it's knowing whether it actually moved the needle. This template helps you answer the questions that matter after launch day: are users adopting it, are they coming back to use it again, and is it making your overall product better?
Compare retention for users who adopted the feature versus those who didn't, so you can make the case with data instead of intuition. Use it after every launch to build a culture of measuring outcomes, not just shipping output.
자주 묻는 질문
How do I measure feature adoption after a product launch?
It’s a way of segmenting your user base by what they’ve been doing lately. Retained users were active this period and last. Resurrected users came back after being inactive. New users showed up for the first time. Dormant users were active before but have gone quiet. This segmentation tells you whether your growth is real — driven by retention and genuine new users — or whether you’re just backfilling churn with reactivations.
What is a good Week 1 feature retention rate?
Match it to how often you expect people to use your product. Weekly product like a task manager? Use 7-day windows. Monthly cadence like a billing tool? Go with 30 days. Longer cycles like travel or seasonal shopping? 90 days makes more sense. This template includes all three views so you can compare and pick the one that reflects your users’ natural rhythm.
How do I know if a new feature is actually improving my product?
This is exactly the kind of mystery lifecycle cohorts are built to solve. Your active user count might be growing because of a flood of new signups or reactivated users, while your retained user count is actually flat or shrinking. If new users aren’t converting into retained users, you’ve got a leaky bucket that top-line growth is masking. This template shows you precisely where the composition is shifting so you can fix the right problem.
What percentage of my users should be trying a new feature?
A retained user was active in both the current and previous period — they’re your consistent, reliable base. A resurrected user was dormant last period but came back this time around. The distinction matters because retained users represent stable engagement, while resurrected users might need different nurturing to keep them from going quiet again. Treating them the same means missing an opportunity to re-engage people at a critical moment.
How do I tell if usage is spreading broadly or concentrated among power users?
Keep an eye on the ratio of retained to new users over time. If your retained cohort is shrinking relative to new users, you’re filling a leaky bucket. The Value Moment Analysis section shows how engagement depth differs between groups, which helps you pinpoint the behaviors that predict long-term retention. From there, focus your product efforts on getting more new users to those high-value behaviors early — that’s where retention is won or lost.