テンプレート
テンプレート
ライフサイクル分析テンプレート
ライフサイクル分析テンプレート
ライフサイクル分析テンプレート
新規、継続、復活、および非アクティブなコホートにセグメント化することで、アクティブユーザーの行動の要因を把握できます。
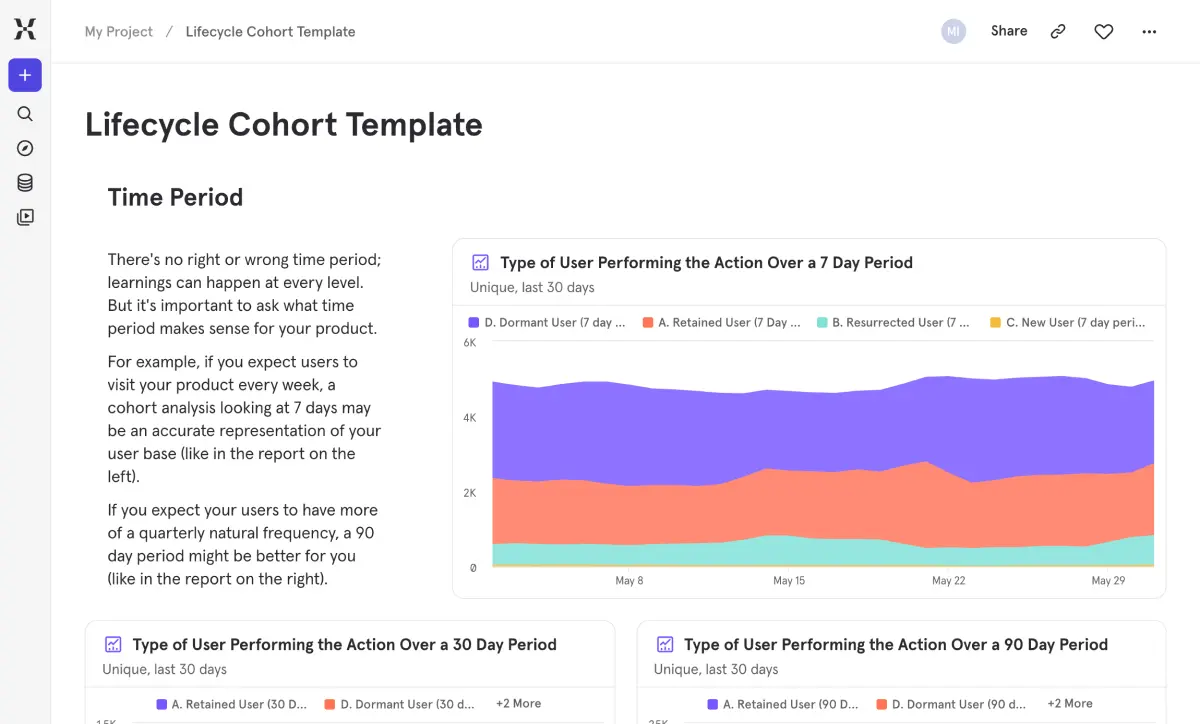
アクティブユーザー数が増加しています。しかし、それは本当に良いニュースでしょうか? トップライン(総数)の数字だけでは、その成長が真に新しいユーザーによるものなのか、休眠ユーザーの復帰によるものなのか、あるいは縮小しつつある忠実な常連顧客ベースが活動を活発化させていることによるものなのかを判断することはできません。
このテンプレートは、ユーザーベースを特に重要な4つのグループ(新規、維持、復活、休眠)に分類し、何が変化を促しているのかを正確に把握できるようにします。成長エンジンが機能しているのか、それともバケツに穴が開いているような状態なのかを診断し、各グループ間でエンゲージメントの深さにどのような違いがあるのかを理解します。これは、「エンゲージメントが伸び悩んでいる気がする」という曖昧な感覚を、具体的で実行可能な課題へと変える分析です。
よくあるご質問
プロダクト分析におけるライフサイクル・コホート分析とは何ですか?
It’s a way of segmenting your user base by what they’ve been doing lately. Retained users were active this period and last. Resurrected users came back after being inactive. New users showed up for the first time. Dormant users were active before but have gone quiet. This segmentation tells you whether your growth is real — driven by retention and genuine new users — or whether you’re just backfilling churn with reactivations.
コホート分析に適した期間はどのように選べばよいですか?
Match it to how often you expect people to use your product. Weekly product like a task manager? Use 7-day windows. Monthly cadence like a billing tool? Go with 30 days. Longer cycles like travel or seasonal shopping? 90 days makes more sense. This template includes all three views so you can compare and pick the one that reflects your users’ natural rhythm.
ライフサイクルコホートから得られる情報は、アクティブユーザー数から得られる情報とどう違うのですか?
Active user counts treat every user the same — a brand new signup, a loyal regular, and someone returning after months away all count as one. Lifecycle cohorts break that single number into four distinct groups so you can see the composition behind the trend. That’s how you spot things like a growing user base that’s actually being driven by reactivations rather than genuine new adoption, or a retained cohort that’s quietly shrinking while new signups keep the total looking healthy.
リテインユーザー(継続ユーザー)とレザレクテッドユーザー(復帰ユーザー)の違いは何ですか?
A retained user was active in both the current and previous period — they’re your consistent, reliable base. A resurrected user was dormant last period but came back this time around. The distinction matters because retained users represent stable engagement, while resurrected users might need different nurturing to keep them from going quiet again. Treating them the same means missing an opportunity to re-engage people at a critical moment.
継続率向上のために、ライフサイクルコホートをどのように活用すればよいですか?
Keep an eye on the ratio of retained to new users over time. If your retained cohort is shrinking relative to new users, you’re filling a leaky bucket. The Value Moment Analysis section shows how engagement depth differs between groups, which helps you pinpoint the behaviors that predict long-term retention. From there, focus your product efforts on getting more new users to those high-value behaviors early — that’s where retention is won or lost.