テンプレート
テンプレート
マーケティングKPIテンプレート
マーケティングKPIテンプレート
マーケティングKPIテンプレート
マーケティングファネル全体を通じて、キャンペーン活動をビジネス成果に結びつけます。
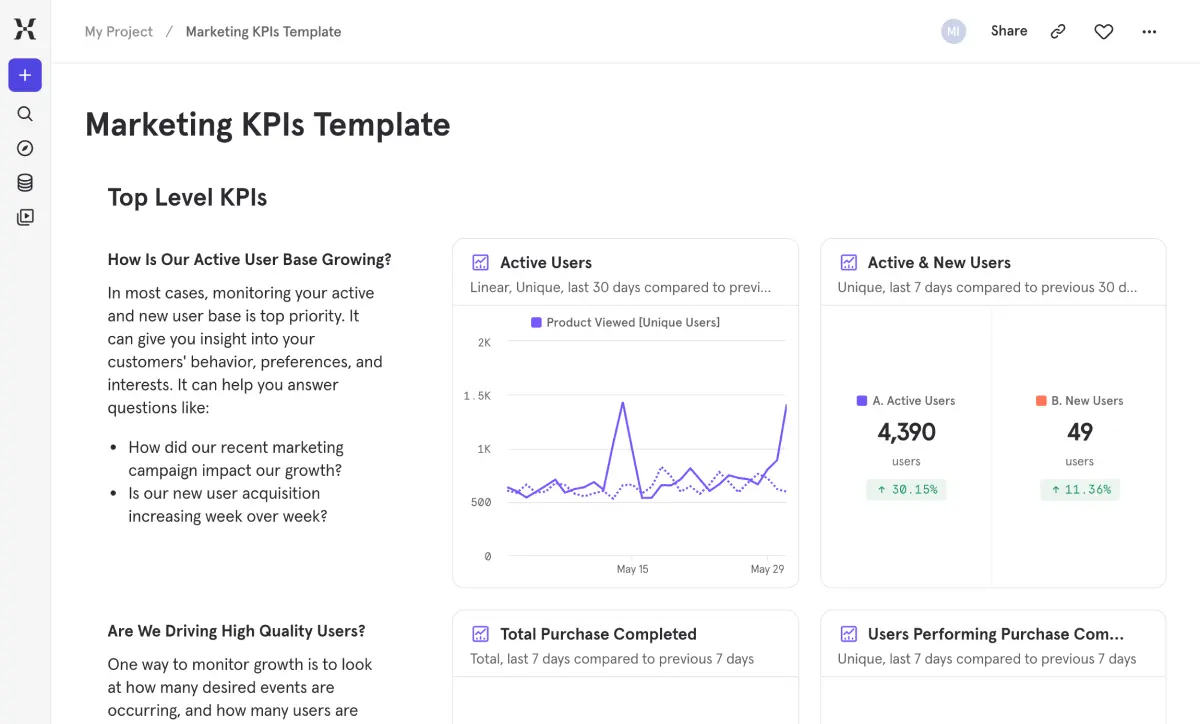
マーケティングチームは、自社がいくら費やしているかは把握していても、その支出を真に重要なこと(エンゲージメントの高いユーザーや収益)に結び付けるのに苦労することがよくあります。このテンプレートは、獲得チャネルを下流の行動(単なるクリックや会員登録だけでなく、セッションエンゲージメント、コンバージョン、リテンションなど)に関連付けることで、そのギャップを埋めます。
キャンペーンが質の高いトラフィックをもたらしたのか、あるいは単に量を増やしただけなのかを素早く判断し、新規訪問者がコンバージョンに至るまでにどれだけの時間がかかるかを確認できます。1回きりの訪問で離脱してしまうユーザーと、定着するユーザーをどのチャネルが生み出しているかを特定しましょう。これは、マーケティングチームを虚栄の指標ではなく、成果の周りに整列させる共有ダッシュボードです。
よくあるご質問
プロダクト分析ツールで追跡すべきマーケティングKPIにはどのようなものがありますか?
Cover the full funnel: acquisition (new users by channel, conversion rates), engagement (active users, session duration, bounce rate, pages per session), and conversion (first-visit conversion rate, time to first purchase). This template organizes all of them from the top-level overview down to channel and session detail, so you can see both the big picture and where to zoom in.
さまざまなマーケティングチャネルからのトラフィックの質を測定するには、どのようにすればよいですか?
Look at what people do after they arrive, not just that they showed up. This template tracks users from channel through engagement metrics (bounce rate, session depth, top events) to conversion (first-visit conversion, time to purchase). A retention curve for each channel shows which ones produce users who keep coming back. That’s the real measure of quality — not clicks, not even signups, but lasting engagement.
マーケティング支出とコンバージョン成果をどのように結び付ければよいですか?
The Ad Spend section lets you track cost per click and total spend right alongside your conversion data. When you can see acquisition cost next to first-visit conversion rates, time to first purchase, and retention by channel, the ROI math gets a lot clearer. It takes the guesswork out of budget allocation and gives you something concrete to point to when someone asks why you’re shifting spend.
初回訪問コンバージョン率はどのように測定すればよいですか?
First-visit conversion rate tracks the percentage of users who complete a desired action during their very first session. This template calculates it and pairs it with median time to first conversion, so you see both how many visitors convert immediately and how long it takes the rest. Together they tell you whether your landing experience is doing its job or leaving opportunity on the table.
マーケターは、ページビュー以外にどのようなウェブ解析指標を追跡すべきでしょうか?
Pageviews tell you volume, but not much else. This template goes further with session engagement (bounce rate, duration, top events), user-level metrics (active users, new users, geography, platform), and conversion data (first-visit conversion, time to purchase, pre-purchase user flows). The difference between knowing you got 50,000 pageviews and knowing those visitors engaged deeply, converted, and came back — that’s what separates reporting from insight.