テンプレート
テンプレート
Eコマース分析テンプレート
Eコマース分析テンプレート
Eコマース分析テンプレート
売上の追跡、購入動作の分析、コンバージョンの最適化を行い、最適な顧客獲得チャネルを特定します。
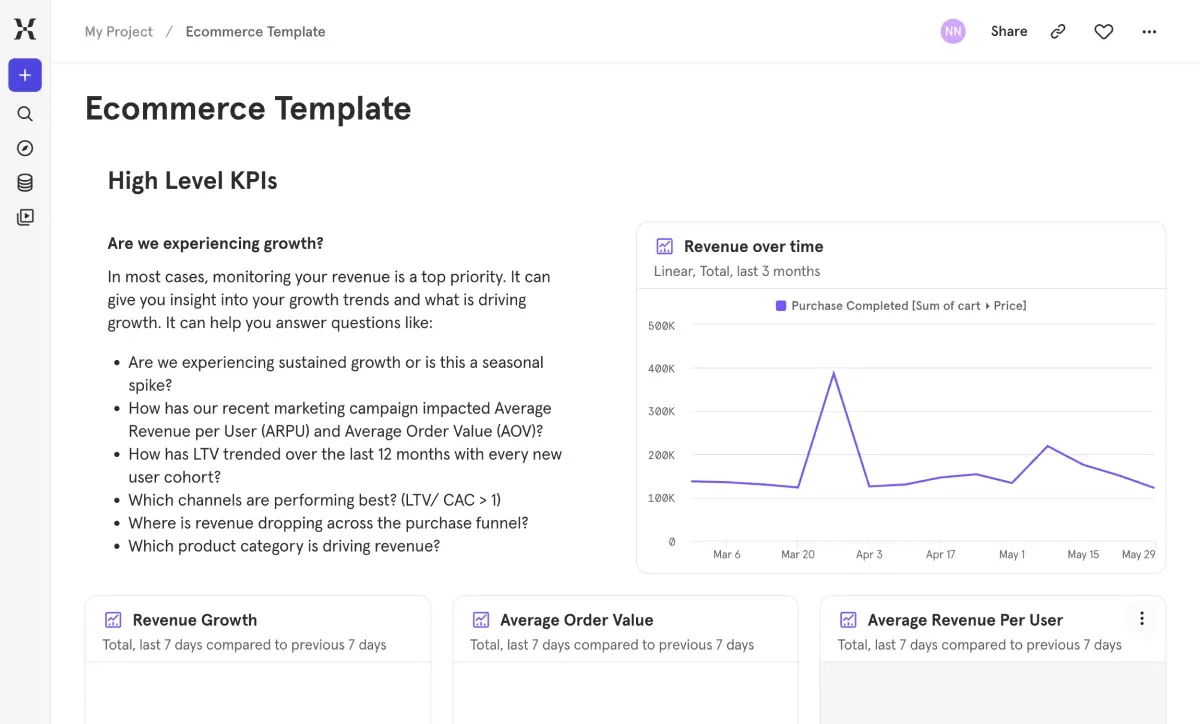
売上は伸びていても、その理由や、次にどのような機会があるのかをご存知ですか? このテンプレートは、eコマースチームが総売上高にとどまらず、顧客が何を購入しているのか、購入に至る前のどこで離脱しているのか、そしてどの獲得チャネルが最も価値の高いバイヤーをもたらしているのかを理解するのに役立ちます。
チェックアウトフローにおける摩擦点を見つけ、成長が新規顧客によるものかリピーターによるものかを把握し、実際にまた戻ってきてくれるバイヤーをどのチャネルが呼び込んでいるかを特定します。ファネルのどの部分を最適化すべきか手探りで推測するのをやめ、データに語らせましょう。これこそが、単に売上を報告することと、実際にビジネスを理解することの違いです。
よくあるご質問
Eコマースストアでは、どのようなアナリティクスを追跡すべきですか?
Start with the basics: revenue trends, who’s buying, and whether they come back. From there, you want to understand purchase behavior (what are people buying and how often), where your funnel leaks (cart abandonment, checkout drop-off), and which acquisition channels bring customers who actually stick around. This template covers all four areas so you’re not stitching together reports from five different tools.
購入ファネルのどこで顧客が離脱しているか、どのように特定すればよいですか?
The template includes a multi-step purchase funnel that shows conversion rates between each stage — product view, add to cart, checkout, purchase. You can see exactly where the biggest drop-offs happen. A user flow report then shows what people do instead of converting at each step, which is often more revealing than the drop-off numbers alone. Pair that with the time-to-purchase data and you’ll know both where and when friction is costing you sales.
どのマーケティングチャネルが最も価値の高い顧客を獲得できているか、どのように測定すればよいですか?
Volume isn’t the whole story — you need to know whether those customers stick around. The acquisition section shows top channels by new customer count and conversion rate, but the real insight is in the purchase retention report. It shows whether customers from each channel come back to buy again. A channel that drives tons of first-time buyers who never return might be less valuable than a smaller channel with loyal repeat customers.
オンラインストアの「購入までの時間」はどのように測定すればよいですか?
This template includes a time-to-purchase distribution that breaks down conversion windows — what percentage of purchases happen within minutes, hours, or days. It helps you set realistic remarketing windows and understand whether your purchase cycle is getting shorter or longer over time. If most conversions happen within 24 hours but your retargeting campaigns run for two weeks, that’s useful information.
Eコマースのファネルコンバージョン率はどのくらいが望ましいですか?
E-commerce funnels typically convert between 1–5% end-to-end, but the absolute number matters less than knowing where your biggest drop-offs are. This template breaks down conversion between each step — product view, add to cart, checkout start, purchase — so you can focus optimization on the stage that’s costing you the most. Improving a 40% drop-off at checkout will do a lot more for revenue than squeezing another percent out of the top of funnel.
Mixpanelで製品またはブランドごとに収益を追跡するにはどうすればよいですか?
As long as your purchase events include product or brand metadata, the revenue-by-brand breakdown populates automatically. You can click into any brand to see detailed trends and compare performance across your catalog. If your data is already flowing into Mixpanel with those properties, you’ll have this view up and running in minutes.