テンプレート
テンプレート
企業KPIテンプレート
企業KPIテンプレート
企業KPIテンプレート
エンゲージメント、リテンション、成長率など、プロダクトの健全性を1つの統合ダッシュボードで測定できます。
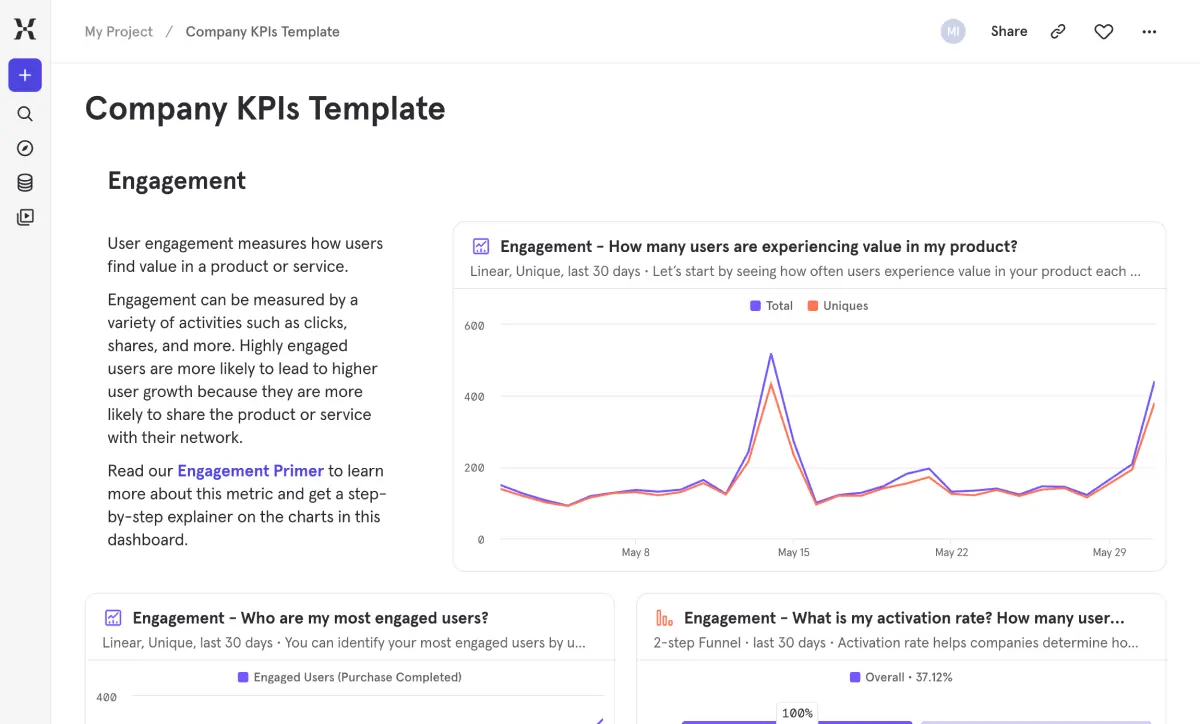
あなたのプロダクトは本当に健全ですか?それとも、単に都合の良い数字だけを見ていませんか?このテンプレートは、すべてのプロダクトチームが足並みを揃えるために答えるべき3つの質問(「ユーザーは価値を見出しているか」、「ユーザーは再訪しているか」、「ユーザーベースは成長しているか」)に答えるのに役立ちます。
その場限りのレポートを寄せ集める代わりに、エンゲージメント、リテンション、成長を紐付ける単一のダッシュボードを手に入れることができます。強力な新規登録数によってリテンションの低下が隠されてしまうといった問題を、収益に影響が出る前に早期に発見しましょう。これは、日々のチームスタンドアップ、取締役会、そして計画策定のサイクルなど、あらゆる場面で参照することになるダッシュボードです。
よくあるご質問
プロダクト分析ツールで追跡すべき企業のKPIにはどのようなものがありますか?
Focus on the three things that tell you whether your product is actually working: engagement (are users finding value?), retention (are they coming back?), and growth (is the user base expanding?). This template tracks all three — daily active users experiencing value, activation rate, most engaged cohorts, dormant user trends, retention curves, DAU/WAU, new signups, and channel-level acquisition. Together they give you one place to check instead of five.
プロダクトエンゲージメントとリテンションを一緒に測定するにはどうすればよいですか?
They’re two sides of the same coin — highly engaged users tend to retain better, and poor retention is often an engagement problem in disguise. This template puts them side by side so you can see the connection directly. The engagement reports show who’s reaching your value moment and how active your best cohorts are. The retention reports show whether those users stick around or quietly disappear. Viewing both together helps you spot when engagement gains aren’t translating into lasting retention.
製品が成長しているかどうかを追跡する最善の方法は何ですか?
Look at growth from multiple angles — not just signups, but whether new users are sticking around and whether your existing base is staying active. This template shows acquisition trends alongside retention curves and dormant user counts, so you can see the full picture. Healthy growth shows up as a stable or expanding retained user base, not just a bigger top-of-funnel number.
アクティベーション率はどのように追跡すればよいですか?
Activation rate tells you how quickly new users reach your product’s value moment — say, completing a purchase or finishing onboarding. This template includes a two-step funnel that calculates it automatically and tracks the trend over time. You can swap in whatever steps match your specific value moment, so it works whether activation means creating a project, inviting a teammate, or making a first transaction.