テンプレート
テンプレート
SaaSビジネスKPIテンプレート
SaaSビジネスKPIテンプレート
SaaSビジネスKPIテンプレート
MRRの推移、前月比の収益変動の要因、そしてチャーン(解約)がどこに集中しているかを把握しましょう。
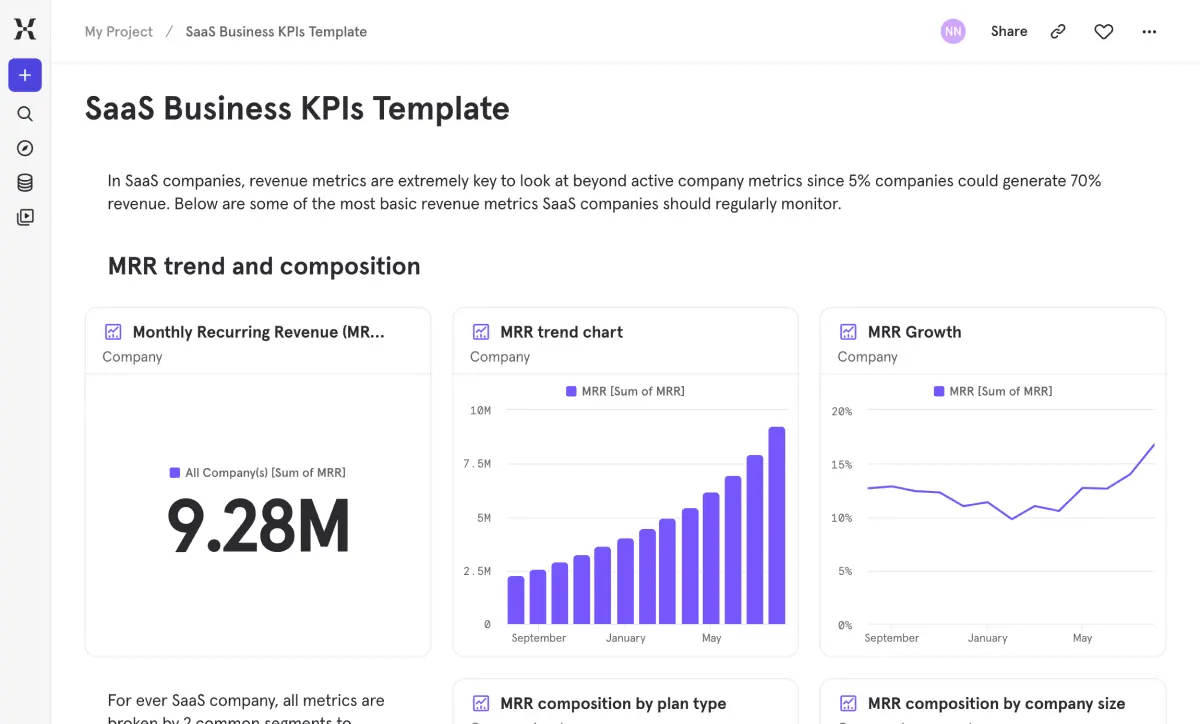
すべてのSaaS経営陣は、同じ核心的な問いに答える必要があります。それは、「収益は効率的に成長しているか」、「その成長はどこからもたらされているか」、そして「すでに獲得した収益を維持できているか」という問いです。このテンプレートを使用すれば、スプレッドシートをつなぎ合わせたり、財務チームのレポートを待ったりすることなく、これら3つの問いすべてに答えることができます。
新規ロゴ、拡大、あるいは再活性化のどれが成長を牽引しているのか、そして解約(チャーン)が特定のセグメントで利益を損なっていないかを、素早く特定できます。どのプランタイプや顧客セグメントが最も強力な収益エンジンであり、どれに注意が必要なのかを把握しましょう。これは、すべての取締役会、四半期ビジネスレビュー(QBR)、および計画サイクルで活用できるダッシュボードです。
よくあるご質問
プロダクトアナリティクスダッシュボードで追跡すべき主要なSaaSメトリクスは何ですか?
The essentials: MRR (monthly recurring revenue), MRR growth rate, net revenue retention (NRR), gross revenue retention (GRR), and logo churn rate. But top-line MRR alone doesn’t tell you much — you need to understand composition (which plans and segments drive the most revenue) and what’s changing month over month (new business, expansion, contraction, churn). This template covers all of it in one place.
ネットレベニューリテンション(NRR、純売上維持率)はどのように計算すればよいですか?
NRR measures the percentage of recurring revenue you retain from existing customers, including expansions and contractions. Above 100% means your existing base is growing faster than it’s churning — which is the gold standard for SaaS. This template calculates NRR automatically and tracks it over time, broken down by plan type and customer segment so you can see exactly which parts of your base are expanding and which are contracting.
SaaSにおいて、健全なグロス売上維持率(Gross Revenue Retention Rate)はどのくらいですか?
Above 80% is generally considered healthy, and best-in-class SaaS companies hit 90%+. GRR strips out expansion revenue, so it isolates how well you hold onto existing contract value — no upsells inflating the number. This template tracks GRR alongside NRR and logo churn, so you get the full picture of where revenue is leaking and whether it’s concentrated in specific plans or segments.
MRR(月間経常収益)の変動要因を分析するにはどうすればよいですか?
The net MRR section breaks it down clearly: delta MRR (the total month-over-month change), a composition view by revenue change type (new, upgrade, downgrade, churn), and deep dives into new MRR by plan and segment. It answers whether growth is coming from landing new logos, expanding existing accounts, or a specific segment punching above its weight. When MRR moves, you’ll know exactly why.
Mixpanelで顧客セグメントごとにチャーン(解約率)を追跡するにはどうすればよいですか?
The template breaks down churn and retention by both plan type (premium, basic, trial, free) and company segment (SMB, Mid Market, Enterprise). NRR deep dives trend over time for each segment, so you can spot whether churn is concentrated in smaller accounts, specific tiers, or spreading across the base. That segmentation helps you aim retention efforts where they’ll have the most revenue impact instead of treating churn as one monolithic problem.
SaaSの請求データがStripeや他のシステムにある場合でも、このテンプレートを使用できますか?
Yes. Send billing and subscription data from Stripe or any billing system into Mixpanel via a CDP, direct integration, or warehouse import. Once your revenue events include properties like MRR amount, plan type, segment, and revenue change type, the reports populate automatically. Mixpanel’s warehouse connectors also let you sync subscription data directly from your data warehouse — no additional instrumentation required.