テンプレート
テンプレート
機能ローンチ分析テンプレート
機能ローンチ分析テンプレート
機能ローンチ分析テンプレート
新機能が受け入れられ、定着しているか、そしてプロダクトのコアな体験に影響を与えているかを把握しましょう。
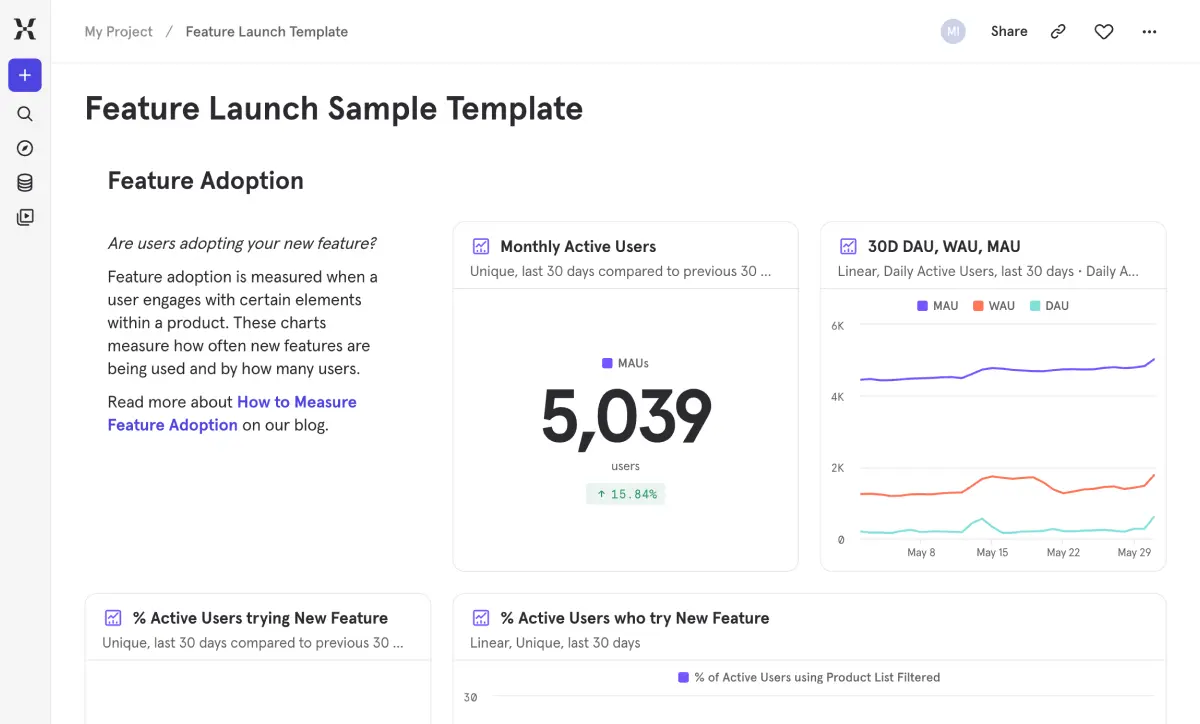
機能をリリースしました。次は何をすべきでしょうか?どのようなローンチにおいても、最も難しいのは構築することではなく、それが実際に成果をもたらしたかどうかを知ることです。このテンプレートは、ローンチ日以降の重要な疑問に答えるのに役立ちます。それは、「ユーザーはその機能を採用しているか?」「再び使うために戻ってきているか?」「それによって製品全体がより良くなっているか?」という疑問です。
その機能を採用したユーザーと採用しなかったユーザーの定着率を比較することで、直感ではなくデータに基づいて根拠を示すことができます。すべてのローンチ後にこれを使用し、単にアウトプットをリリースするだけでなく、成果を測定する文化を築きましょう。
よくあるご質問
プロダクトローンチ後にフィーチャー(機能)の採用率を測定するにはどうすればよいですか?
It’s a way of segmenting your user base by what they’ve been doing lately. Retained users were active this period and last. Resurrected users came back after being inactive. New users showed up for the first time. Dormant users were active before but have gone quiet. This segmentation tells you whether your growth is real — driven by retention and genuine new users — or whether you’re just backfilling churn with reactivations.
リリース第1週における機能リテンション率の目標値はどれくらいですか?
Match it to how often you expect people to use your product. Weekly product like a task manager? Use 7-day windows. Monthly cadence like a billing tool? Go with 30 days. Longer cycles like travel or seasonal shopping? 90 days makes more sense. This template includes all three views so you can compare and pick the one that reflects your users’ natural rhythm.
新機能が実際にプロダクトを改善しているかどうかを、どのように判断すればよいですか?
This is exactly the kind of mystery lifecycle cohorts are built to solve. Your active user count might be growing because of a flood of new signups or reactivated users, while your retained user count is actually flat or shrinking. If new users aren’t converting into retained users, you’ve got a leaky bucket that top-line growth is masking. This template shows you precisely where the composition is shifting so you can fix the right problem.
新しい機能を試すユーザーの割合は、どれくらいにするべきですか?
A retained user was active in both the current and previous period — they’re your consistent, reliable base. A resurrected user was dormant last period but came back this time around. The distinction matters because retained users represent stable engagement, while resurrected users might need different nurturing to keep them from going quiet again. Treating them the same means missing an opportunity to re-engage people at a critical moment.
利用状況が広く普及しているのか、それとも一部のパワーユーザーに集中しているのかを、どのように見分ければよいでしょうか?
Keep an eye on the ratio of retained to new users over time. If your retained cohort is shrinking relative to new users, you’re filling a leaky bucket. The Value Moment Analysis section shows how engagement depth differs between groups, which helps you pinpoint the behaviors that predict long-term retention. From there, focus your product efforts on getting more new users to those high-value behaviors early — that’s where retention is won or lost.