Fintech, how do you measure up to the rest of the industry?
Get the benchmark report →
Mixpanel
Copy wordmark as SVG
Brand guidelines
Platform
Platform
Product Analytics
Measure & optimize products
Warehouse Connectors
Sync trusted data
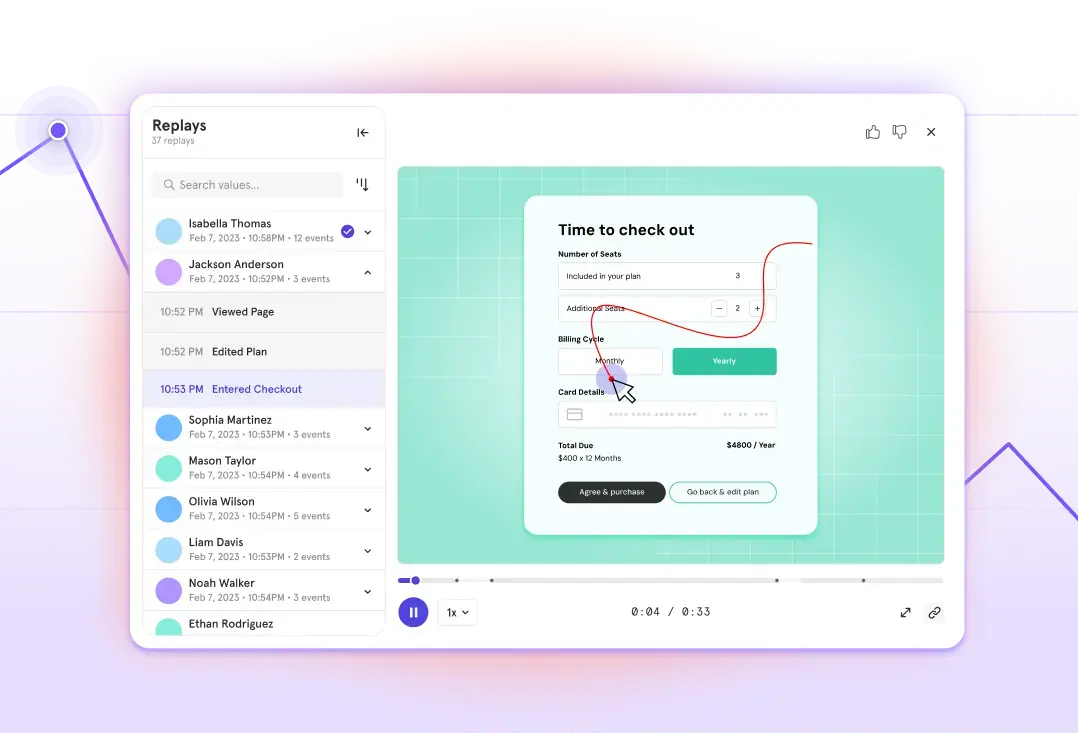
Session Replay
Watch user journeys
Integrations
Connect the tools you love
Security & Privacy
Protect customer data
Use Cases
Acquire New Users
Boost marketing campaigns
Engage Your Users
Activate & retain more users
Grow Your Usership
Multiply your customer base
Empower Your Teams
Allow teams to self-serve trusted data
New
Watch how customers use your product
Session Replay
Solutions
Teams
Product
Data Analysts
Marketing
Engineering
Industries
Finance
Media & Entertainment
B2B
Ecommerce
Healthcare
AI
Business Size
Enterprise
Small and Midsize
Startup Program
Transform data into impact
Get the framework leading executives use
Access the Ebook
Resources
Using Mixpanel
Docs & Guides
Getting started is easy
Contact Support
Access personalized help
What's New
See the latest product updates
Community
Blog
Explore growth strategies
Events & Webinars
Join us virtually and in person
Community
Ask questions and learn
Customer Stories
Impact in action
Partnerships
Become a Partner
Partner and grow with us
Hire an Expert
Get advanced solution support
Builders
Sprig’s Kevin Mandich on a decade of building with ML and AI
Read Article
Analytics
Product Analytics and the data warehouse: A long road to a perfect pairing
Read Article
Pricing
Login
Contact Sales
Get Started Free
Platform
Back
Platform
Product Analytics
Measure & optimize products
Warehouse Connectors
Sync trusted data
Session Replay
Watch user journeys
Integrations
Connect the tools you love
Security & Privacy
Protect customer data
Use Cases
Acquire New Users
Boost marketing campaigns
Engage Your Users
Activate & retain more users
Grow Your Usership
Multiply your customer base
Empower Your Teams
Allow teams to self-serve trusted data
New
Watch how customers use your product
Session Replay
Solutions
Back
Teams
Product
Data Analysts
Marketing
Engineering
Industries
Finance
Media & Entertainment
B2B
Ecommerce
Healthcare
AI
Business Size
Enterprise
Small and Midsize
Startup Program
Transform data into impact
Get the framework leading executives use
Access the Ebook
Resources
Back
Using Mixpanel
Docs & Guides
Getting started is easy
Contact Support
Access personalized help
What's New
See the latest product updates
Community
Blog
Explore growth strategies
Events & Webinars
Join us virtually and in person
Community
Ask questions and learn
Customer Stories
Impact in action
Partnerships
Become a Partner
Partner and grow with us
Hire an Expert
Get advanced solution support
Builders
Sprig’s Kevin Mandich on a decade of building with ML and AI
Read Article
Analytics
Product Analytics and the data warehouse: A long road to a perfect pairing
Read Article
Pricing
Login
Contact Sales
404 Error
There’s nothing here
There’s nothing here
Go Back Home
Visit Help Center