
Subject Lines: not as easy as it looks

A year and a half ago, we tried to answer the age-old question: Why in the heck do people open emails? So, we analyzed a LOT of email subject lines (85,637 over the course of nearly four years, to be exact) to understand open rate patterns. We queried a bunch of variables, such as subject line length, keywords, and the number of emails sent out in the blast, and found some interesting insights.
But a lot can change in eighteen months, so we’re following up with new questions, based on another 72,161 email campaigns.
A quick glance at the data, which stretched from July 1, 2016 through February 13, 2018, showed 4,680,664,333 email sends and 571,967,209 opens, which works out to a 12.3% open rate. This was a touch below what we’d found last time, when then open rate was 13.5%.
As you read on, keep in mind that Mixpanel users have the capability to take a behavior-driven approach to email marketing, segmenting based on user actions rather than adopting a spray-and-pray method. So their email campaigns are likely to be more carefully targeted than your average “batch-and-blast” campaign. For example, if a Mixpanel customer wishes to target users who added items to their cart, but never actually made a purchase, they have the ability to do so, so long as the user still qualifies under those conditions.
The 30,000 foot view
The overall numbers look like this:
72,161 campaigns
4,632,312,683 sends
570,340,258 opens
12.3% open rate overall
19.9% median open rate
The last time we did this, we found a 13.5% open rate overall, and the main conclusion we drew then still stands: the vast majority of these emails are going unread. But by looking at the median number, the standard increases a bit to 19.9%, which is probably a fairer target for teams, and, perhaps as importantly, provides a neat, clean 20% target for above average campaigns.
The median campaign
By running a quick summary of the data in R, we were able to pull together median numbers in the above categories. To the extent that there is a “median campaign,” it looks like this:
4027 sends
743 opens
19.9% open rate
42 character subject line
You’ll note that 743/4027 is not in fact, .199, which reflects that it’s easier (and therefore more tempting) to send out more emails than it is to actually get people to open them. In other words, the “sends” distribution skews further left than the “opens” one.
Still, there is value in understanding that getting 750 opens puts you above average. On some level, the point of a good open rate is to get a lot of opens, after all. If a marketer has to be a touch spammy to do so, that’s not ideal, but it’s not the worst thing in the world. A user who receives your email and opens it 10% of the time is more valuable than someone who has unsubscribed, unless you’re an engagement-above-all-else sort, in which case, redefine the terms of who you’re sending emails to find a more narrow audience.
The 90th percentile campaign
Taking the same idea and looking at 90th percentile numbers in these categories shows what the extremes look like:
102,039 sends
13,304 opens
46.0% open rate
74 character subject line
As we saw with the 2017 Product Benchmarks Report, there can be a wide margin between median and 90th percentile performance.
Like the “median” campaign, these individual metrics are not directly related to one another. Increasing sends and subject line length does not correlate to a higher open rate.
A 74 character subject line is not “better” than a shorter one. Know that if you’re at that length, only 10% of email marketers have gotten there, and thought “yep, let’s keep on adding words in there.”
Open rate by send volume
The ratio between the 90th percentile and the median in opens is a staggering 18:1, but an even larger 25:1 in sends. These are categorically different kinds of campaigns. Anecdotally, this would seem to suggest that higher volume email campaigns should expect lower open rates.
But we don’t do things anecdotally when there’s data around. Here’s what the numbers say:
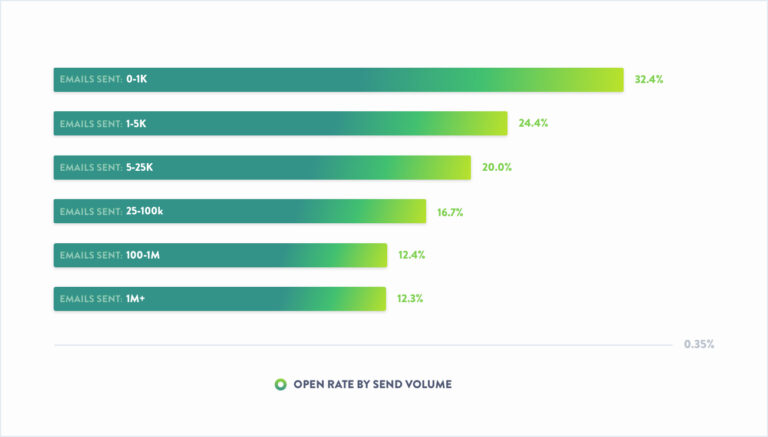
Indeed! The pattern we saw 18 months ago repeats: bigger sends mean lower open rates. If I’m one of a million people receiving an email, odds are it’s not going to be as carefully tailored to me as if I’m one in 5,000. And the more people opt out of your email campaigns, the more likely those who stay are to open what you’re sending them. Always account for selection bias!
The distribution of the data by open rate
Zooming out for a second, it can be useful to look at what the total distribution looks like, to help understand on a broad level, what the shape of the data is. Here’s the number of email campaigns organized by open rates into groups of 5%.
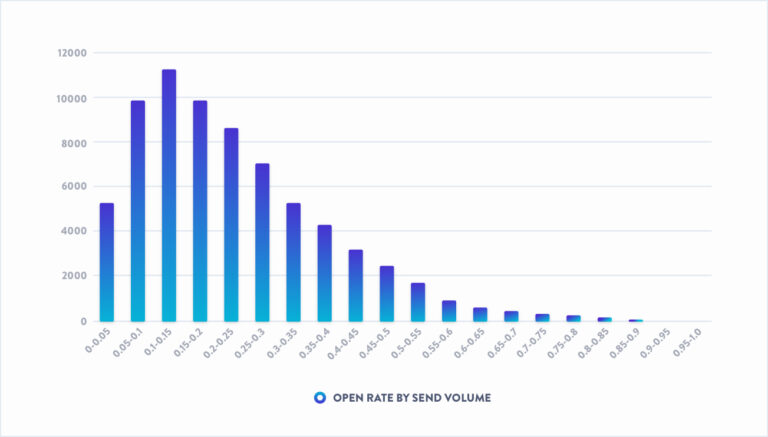
There’s something very satisfying about a nice even slope, isn’t there? The 10-15% range is modal, and you can see that the data skews right, meaning the preponderance of the outliers are on the higher rather than the lower side of the distribution.
This is where data analysis becomes tricky. We now have a mean and a mode in the 10-15% range and a median at just under 20%. A nefarious marketer trying to lower expectations can print out this graph and say, “well, the highest bar is the 10-15% range,” in justifying their underperforming emails. Don’t let them! Median is the most reliable metric; it is the least susceptible to skewing from outliers, and more difficult to manipulate by changing the size of the buckets.
When it comes to subject lines: less > more
One topic I’d touched on previously was subject line length. What’s the right one? As noted, the collective wisdom would suggest that the median number—42—is the answer to everything, but… what if it’s not?
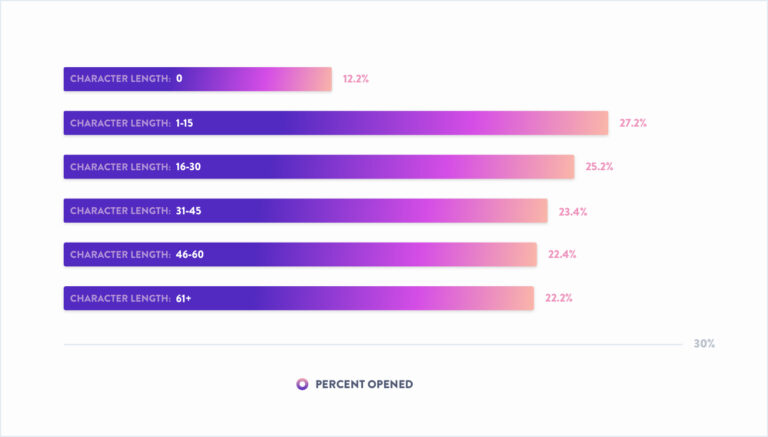
(It’s not).
The data suggest that first and foremost, you really should write a subject line. I realize this isn’t exactly master class-level wisdom, but if you want to do a professional email campaign, you need to… actually do something rather than doing nothing.
That aside, the general trend seems to show diminishing returns as subject lines get longer, although let’s not overstate the size of these declines. Dropping from 27.2% to 22.2% is not exactly a precipitous fall. The thing to keep in mind here, is the way that having an appropriate-length subject line (between 1 and 60 characters) is enough to bump your expectations up from the 19.9% median number of all emails.
So yes, by all means, keep it brief. But if you have a snazzy subject line on the longer side, you can expect similar performance. And keep in mind, that despite what everyone may say, when it comes time to vote with their actions, emailers keep it at 42 characters, so sending something out at that length is perfectly appropriate.
Correlation isn’t causation, but it’s not nothing
I learned to program in R for a reason, and you’re all going to have to sit here and look at this snazzy correlation graph I put together!
Here’s the code, in case you want to try a version of this at home with your own dataset.
(everything looks techy in Courier)
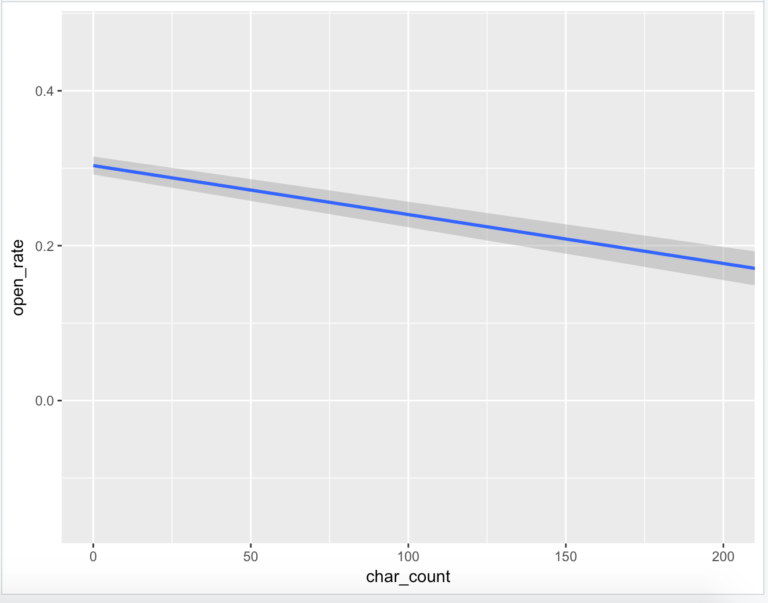
We can see there is a slight downward trend as subject line character count increases. If we want, we can look at the correlation numbers between open rate, and both subject line length and number of emails sent, just to put a nice little bow on the previous few sections.
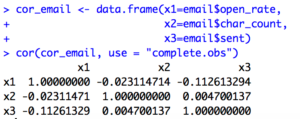
The main takeaways here: x2 (character count) and x3 (number of emails sent) are both very slightly negatively correlated with x1 (open rate), but not so much so that we should form grand conclusions just yet.
While this data is somewhat ambiguous on this point, it should confirm any communicators’ priors: the less you talk, the more they listen.
It’s speculative, but my instinct is that these (weak) correlations are not totally causation, and the confounding variable is familiarity with one’s audience. Consider it a variation on the sociological distinction between a high-context and a low-context culture, which says that high-context societies such as Finland, in which the vast majority of people have a great deal of shared experiences, simply require less verbal communication than low-context ones, such as India.
In other words, if an emailer’s audience shares a lot of cultural context, less needs to be said. Think of the subject you’re most passionate about, and imagine the difference between talking about it to someone else who cares as much as you versus someone who is totally unfamiliar with it. Simply trimming the list or character count at random is not going to change things. Sometimes the audience needs to change.
Test it out on your own lists: try culling your sends down to a more specific demographic segment in one experiment, and abbreviating the subject line length in another. See what performs better, and you’ll know whether your problem is long-windedness or an incoherently segmented list.
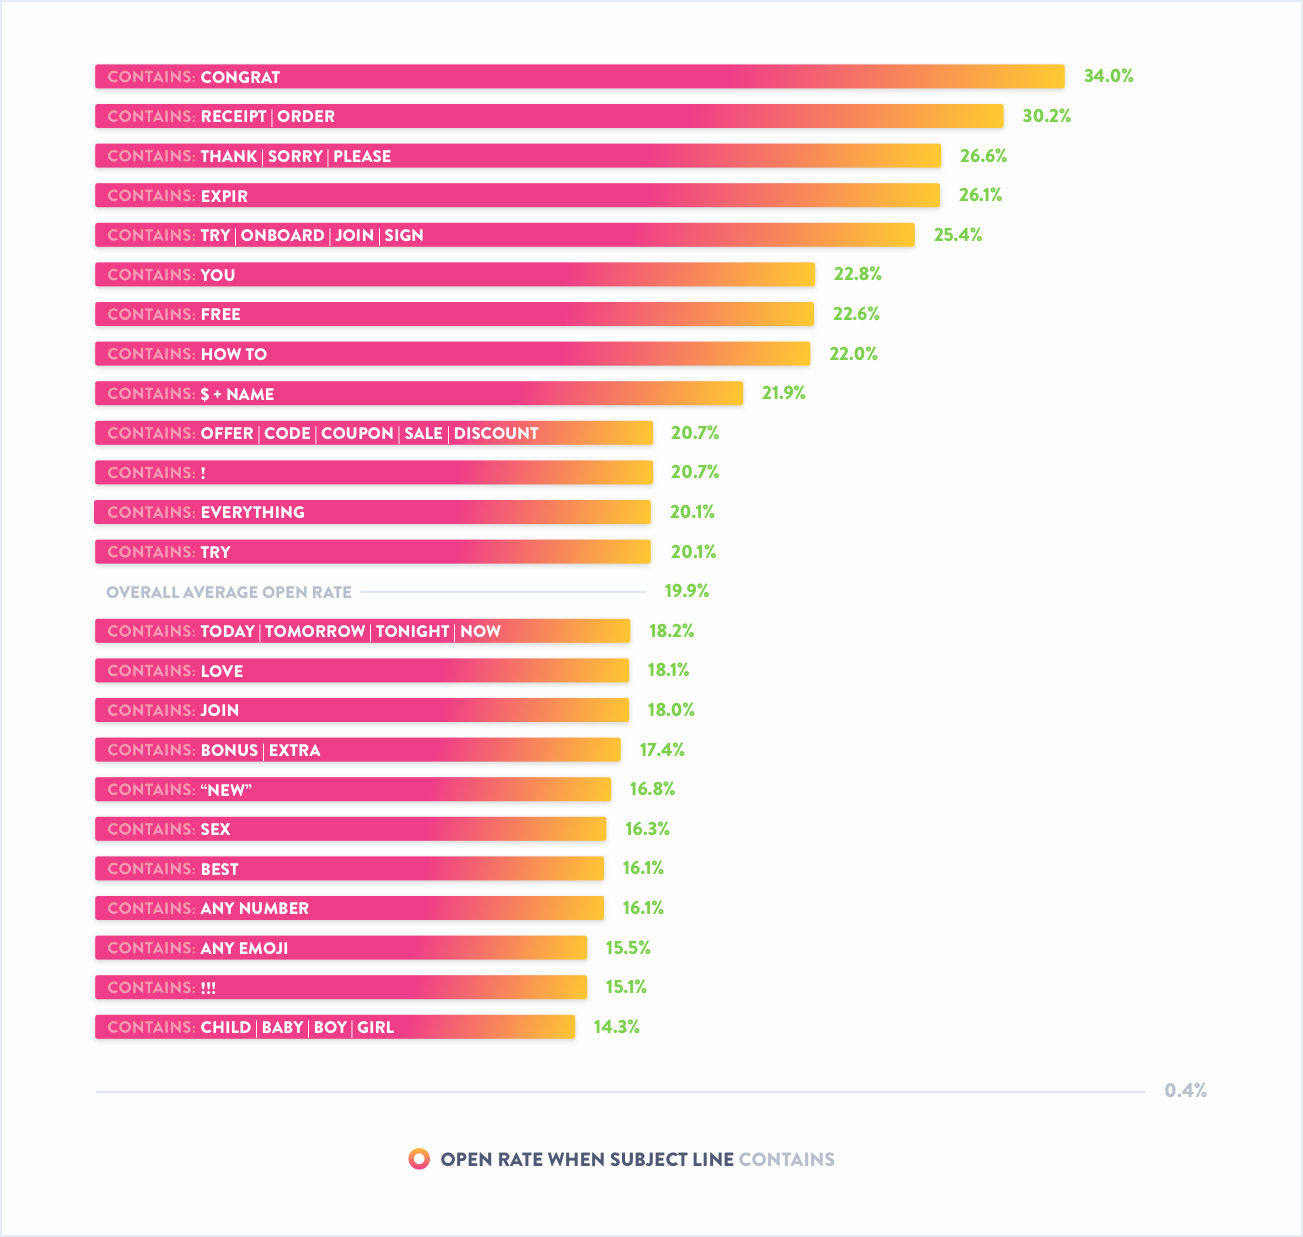
Terms to avoid
Here’s a fun area: how do specific words and terms perform in subject lines?
A quick note on methodology here: I took the median open rate rather than the total open rate that used in the last survey, so some of these, particularly the “offer OR code OR coupon OR sale OR discount” were more consistent on that metric from the last report to this one. However, by looking at where these median numbers compare to the overall median, we can get a better sense of which terms are helping emails get opened, and which ones are not.
The misanthrope in me immediately looks to the bottom of the chart, where hilariously, everyone’s least favorite things: emojis, being yelled at, children, and numbers all perform terribly, with open rates at 16% or worse. If you wouldn’t say it out loud, it probably doesn’t make a great subject line.
Following up on research we did in the previous iteration of this report, the personalization proxy ($ AND name) performed better (21.9% open rate) than average after doing worse last time (9.34%). Is it possible that people got twice as good at sending these kinds of emails over the course of a year and a half? Sure, but it’s not likely. The more relevant finding is that “you” managed a superior 22.8% open rate, which makes sense, as emails that refer to the reader as “you” are less likely than personalized ones to fall into the uncanny valley.
Good terms to use
Special commendation for “congrat,” which covers all the congratulating variants. It should surprise nobody that people like being told how great they are. “Congrat” gets open rates all up to a 34%. Flattery may not get you everywhere, but it will get you 71% better open rates. In fact, the top half of this chart is littered with terms that are, quite simply indulgent of people’s desire to be flattered. It even managed to beat receipt OR order, which I thought would be able to thump the field, by dint of you know, having information about things people had paid for.
In a similar vein, the politeness proxy (thank OR sorry OR please) continues to perform well, improving its open rate from 23.0% to 26.6%. Being nice: still cool!
Onboarding emails (try OR onboard OR join OR sign) perform surprisingly well, managing 25.4% open rates. Simple calls to action work, and clarify what you want the reader to do. If you make a clear ask, people can know whether or not they’re interested.
How to’s also continue to do well, improving from 20.6% to 22.0% open rates. The idea of learning how to do something from an email persists.
The goodies categories (offer OR code OR coupon OR sale OR discount, improved from 10.3% to 20.7%) and (free, which improved from 17.3% to 22.6%) all beat the averages. It turns out people do, for the most part, want to see what the sales are when receiving emails they’ve signed up for, and on some level makes me wonder if these terms have a version of the “nobody goes there; it’s too crowded,” effect. With emailers so wary of these terms being abused by spammers, their simple, time-tested marketing power has regenerated to some extent.
The single exclamation point also moved ahead of the overall number, at 20.7%. Perhaps social mores have changed enough in the past year and a half that a single exclamation point has moved from over-exuberance to tasteful restraint. So feel free to use exactly one (!) exclamation point.
The urgency inspired by anything containing “expir” (think: expiration, expiring) is a more immediate one than that inspired by today OR tomorrow OR tonight OR now, which are basically at the average. The psychology behind this makes sense; humans are loss-averse, which is to say they feel losing something they have more than they do missing an opportunity of the same value. “Act now!” implies you’ll miss out on something; “Expiring soon” implies it’s being taken away from you, which is more powerful.
In conclusion combining the research on the best terms and subject line length, perhaps the optimal subject line is: Congrats, you!
(Not really, don’t use that. Or do, and let us know how it goes!)
That covers the “what” of your email subject line, but what about the “when?”
When is the right time to send an email?
Open rates are consistent month to month.
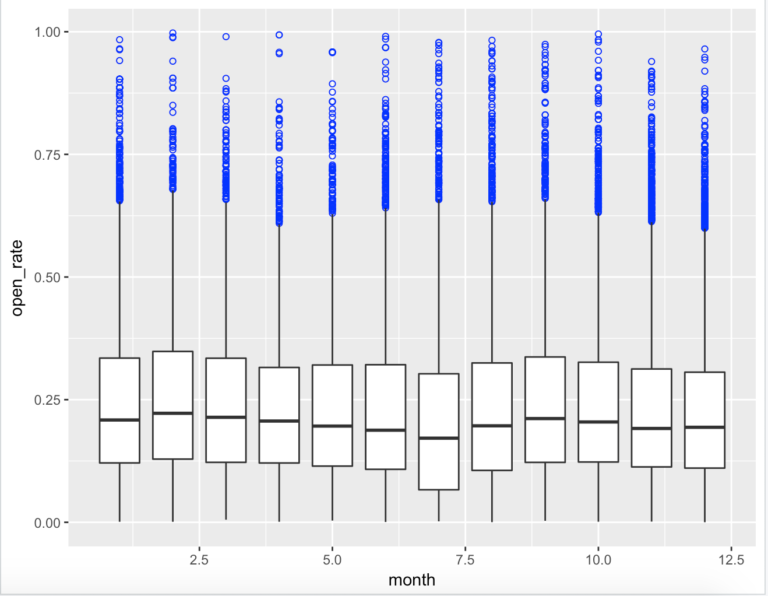
The bars representing the median go up and down, but stay pretty level. Don’t let anyone tell you that what month you send your email out on makes a difference.
But what about day of the week? The activity would seem to suggest that folks have some thoughts on when is best:
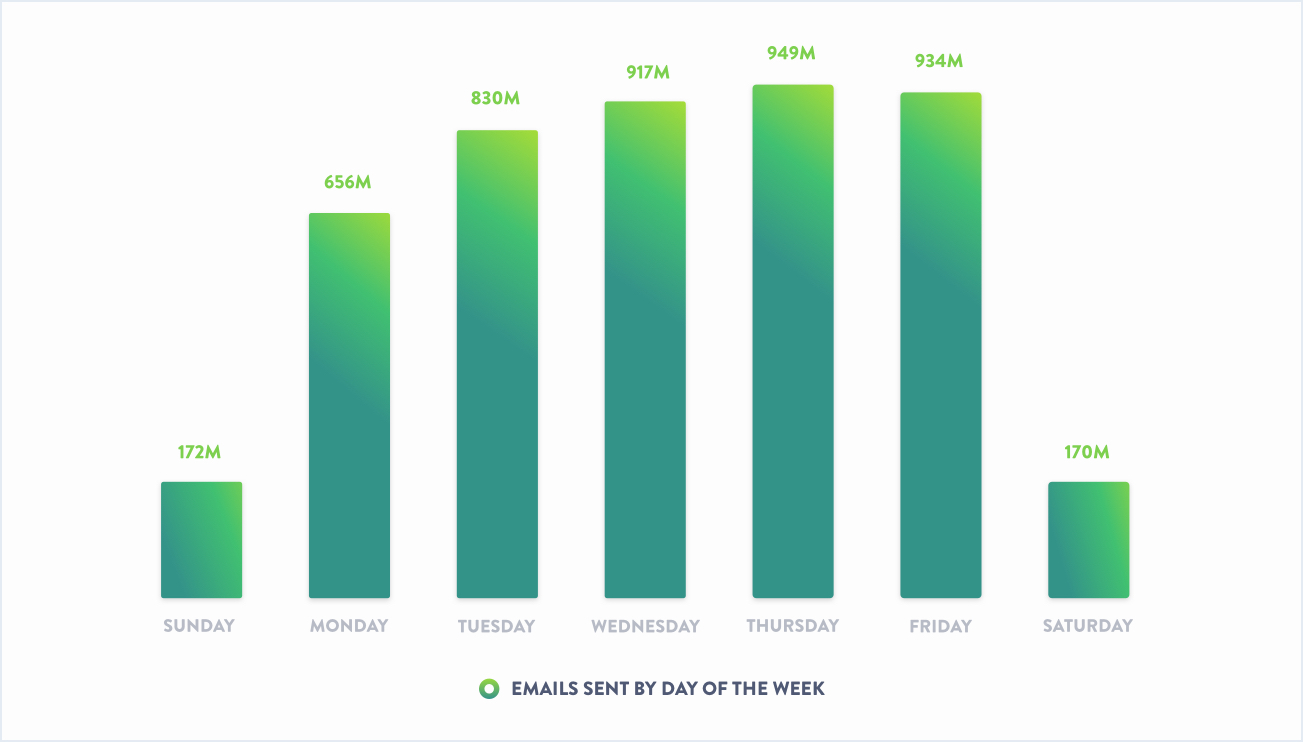
Activity crests Wednesday through Friday, and falls off a cliff on the weekend. It seems to take at least a day or two to get those campaigns up and running.
But are these marketers “right?” Does the back half of the work week perform better?
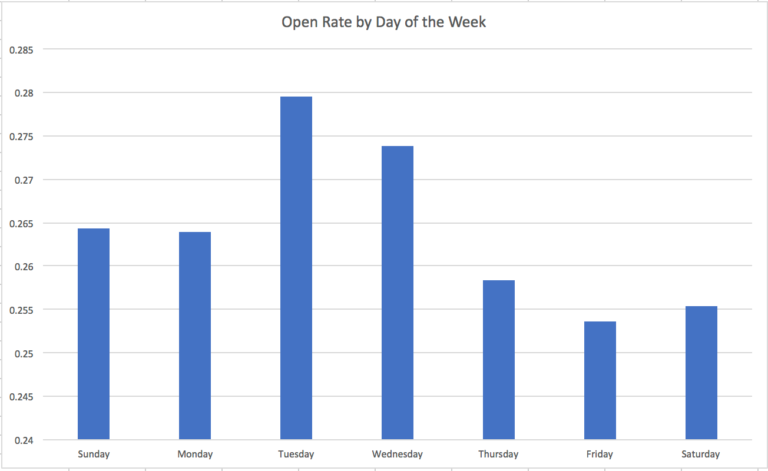
Not really! The opposite pattern emerges with the early part of the work week looking stronger. Except: look carefully at this chart. Can you see what’s wrong with it? Let’s look at the same data from a different angle.
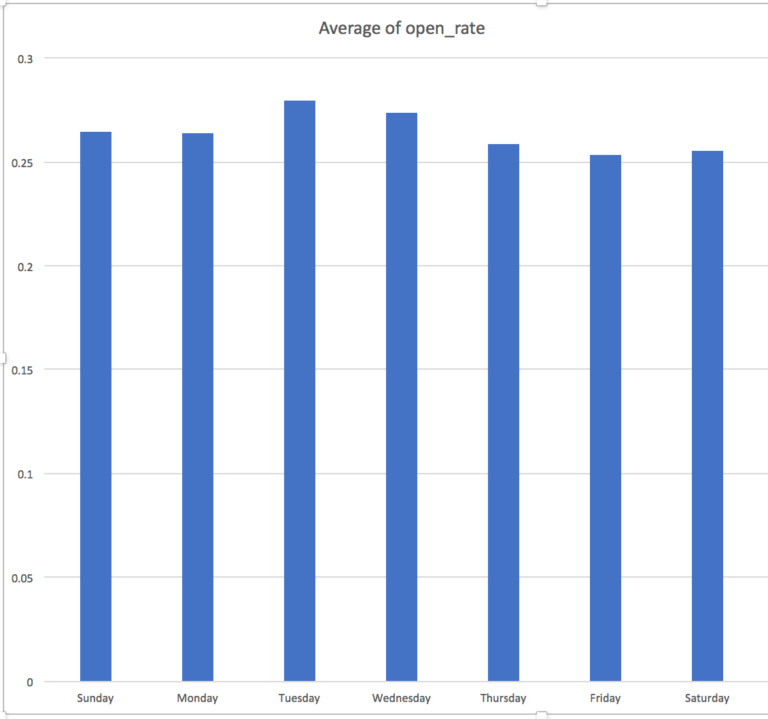
Start your y-axis at 0, people. The difference between 21.9% and 23.7% is a matter of perspective. The zoomed-out view would suggest this is a small difference, and not one that should drive business decisions; in fact, the main takeaway from this graph just echoes the findings from the other sections.
Write a compelling subject line, and send it when it’s ready.