
KPIs to drive your mobile marketing strategy

Introducing Metrics that matter
The Signal is delighted to bring you a new Mixpanel series featuring product managers, growth marketers, data scientists, and engineers who use data to innovate. We’ll be talking to these experts about the tools and techniques they use every day to measure and communicate business success—and how they increase the rate of innovation using data-driven insights.
Have a compelling story to tell about how you use Mixpanel to accelerate your company’s success? Get in touch at: anya.pratskevich@mixpanel.com.
Today, we’re in conversation with Olabiyi “Ola” Dipeolu, Data and Insights Manager at SPC Card, a student loyalty discount program in Canada. We’ll talk with Ola about finding and elevating the metrics that matter to different company stakeholders—and how doing so might just lead to a game-changing business insight.
You’ll learn:
- What a day in the life of a data analyst looks like
- From the card purchases to registrations and app downloads, which metrics matter the most to different stakeholders at SPC
- The biggest challenges in building products for Gen Z
- How tracking user behavior can inform your marketing strategy
Mixpanel: Tell us a little bit about your company.
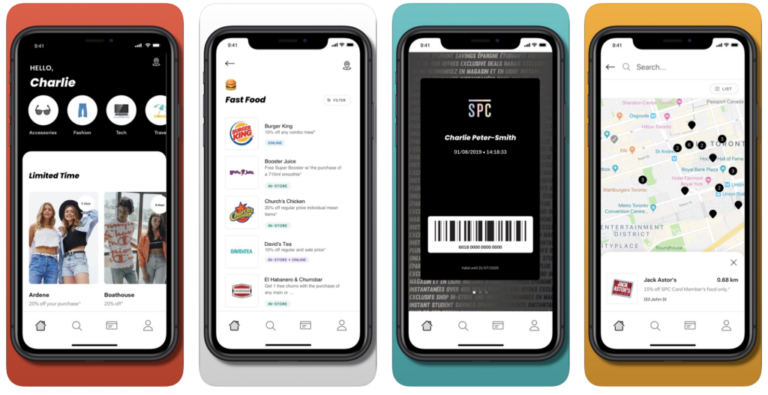
Ola Dipeolu: Founded in 1992, SPC is Canada’s first full national student loyalty program. We help students save money by offering them a discount on the products, services and activities that students care about the most. In fact, we offer more than 450 student deals and discounts, including at Forever 21, Samsung, David’s Tea, and Taco Bell, all for $10 a year. High school and university students can purchase a plastic card in physical locations, but SPC also offers a digital membership through our Android and iOS apps.
What is your role in the company? What does your day-to-day look like?
I lead our analytics practice. I help SPC make better business decisions by examining that data to see what the trends are and how people are behaving so that we can learn how to interact better with them. Every morning, I look at the numbers from the day before—both online metrics and app metrics. Mixpanel allows us to see both, which is a great benefit to our strategic planning ability. Later on in the day I send metrics to the leadership team and break down insights for them. There’s just so much information out there, and it’s crucial that we narrow down what data we want to use. I’ve worked hard to narrow down our data collection to a few KPIs instead of looking at 500 different things.
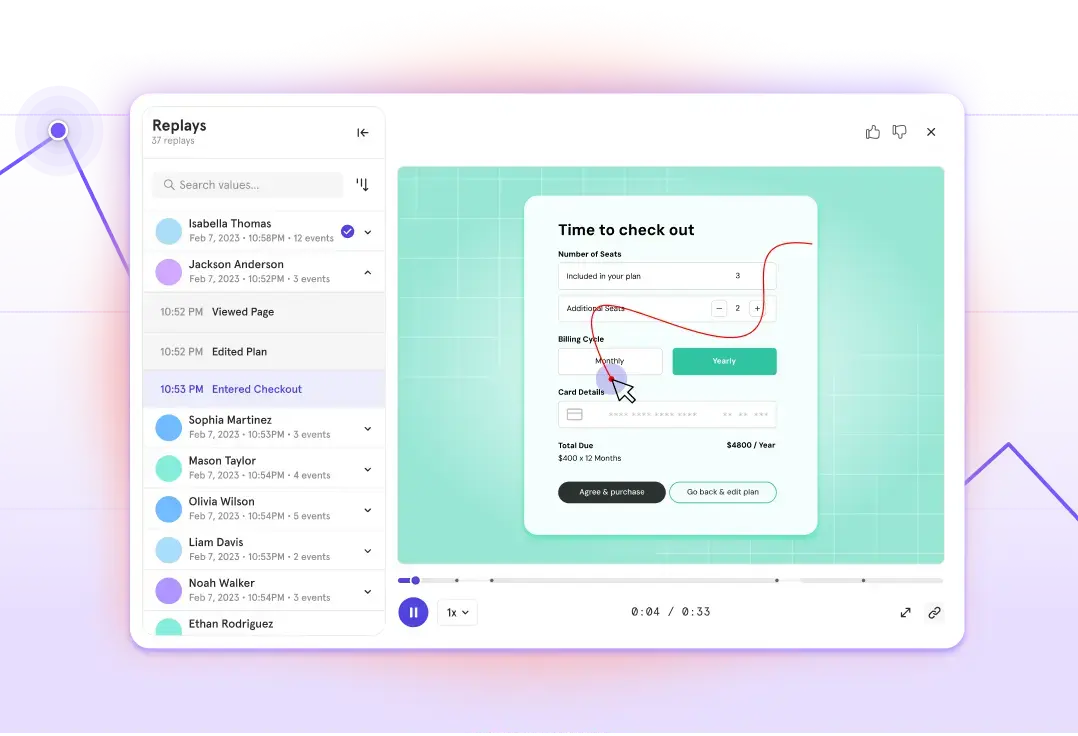
“Custom Alerts give you peace of mind that you won’t miss any important movement in your metrics, like a sudden drop or spike in your KPIs.”
What makes the SPC Card company different from its competitors?
We know times are tough right now for students. We work hard to bring them the best, most relevant deals from retailers they know and trust—and from brands we think they’ll grow to love. Our offer is valid all year long from both national and local retailers. You can get a deal from American Eagle — and a local pizza shop down the street.
What are some of the biggest business challenges that you’re trying to solve?
Unlike any other generation before, our target demographic knows they have plenty of options when it comes to spending their money — and they know what they want. We need to figure out how to constantly deserve and reward their attention. The KPIs we track help tell us that story.

Let’s talk about those KPIs. How do you tie the company’s goals to the metrics that you track?
Here are a few of the KPIs we look at, and why they’re important to decision makers at different levels of our company.
- Number of downloads, which helps our marketing team understand how well their efforts are working, and (possibly) where we need more activity.
- Where the most card purchases and registrations are coming from: that helps us focus on regions we’re not connecting as well with and also increase opportunities in places where we’re getting great results.
- Number of cards sold, because at the end of the day, the more cards we sell the better it is for the business. The executive team is really interested in this one.
- Behavior of people who download cards, who register, who engage regularly, who disappear, etc., so we can adjust our tactics and improve user experience.
“Identify opportunities to increase conversion rates, by pinpointing where and when users drop off in your product or marketing campaign”
- Most visited categories in the app—fashion, food, tech, beauty, etc. We want to know what people are watching the most because that helps the partnership/relationship team.
- App sessions, which is key because we want people to constantly use the app, rather than sign on once or twice and then disappear.
- How genders behave differently, so we can tailor our efforts to those behaviors.
Something I really love and appreciate about Mixpanel is I’m able to see data holistically for both the app and the website, unlike with Google Analytics.
“Mixpanel helps you see how users get where they’re going, what leads them away from there, and what they do afterwards, so you know how to guide them. Compare patterns of returning users to new users to spot where they get stuck in the UI.”
We can also start tracking new/different information if, for example, our client team comes to us seeking specific information that they want to present to a potential new partner.
How do all of these metrics inform what your company does?
I take the data-driven information to the leadership team, and it is then dispersed to the respective leaders of our different teams. They use what we learn to target partners. For example, during the winter holidays, female students from Toronto are on the app more than they regularly are. That’s information that we can take to a partner in order to get even better deals for the students because, at the end of the day, our goal is to make sure that students are taking advantage of the deals we offer.
Is there one metric that is your greatest focus?
The retention funnel. We look at it in order to focus on the customer. We care about their engagement. On the acquisition side, we track card purchases, registrations and app downloads.
How do you communicate metrics to the leadership team? The marketing team?
We provide daily metrics via multiple Mixpanel dashboards. Every morning at 6am, teams get an email with the KPIs they ought to take a look at. Once a week, I share a document that tracks week-to-week behavior and that includes my data-driven insights and recommendations. Every month, I do the same thing. And, of course, I am always ready to perform ad hoc reporting and analysis. With Google Analytics, tracking performance metrics will take a day. But with Mixpanel, I can see changes hourly; I can select a date range and have it updated straight away.
“Keep a pulse on your most important metrics with Mixpanel’s easy-to-build Dashboards. Share them with your team through email digests, and let Mixpanel notify you when your metrics hit a certain number, or change by a certain amount.”
The leadership dashboard includes data and insights that are important in order for them to make high-level decisions. That information and those insights are different from those that I send to the marketing team, which concentrates specifically on marketing metrics—which partners are clicked on the most or which collections are clicked on the most. I don’t tell the leadership team about the most clicked categories, but for the marketing team that’s important. On the other hand, the marketing team doesn’t really need to know the number of registrations—that’s information that is of more interest to the leadership team.
The marketing team dashboard captures category views, partners viewed, redemption rates—how many people click “redeem online” or “purchase now”—how many people take a look at the “limited time” offers, collection views, the number of unique ad opens, and app downloads. For marketing team, it’s very useful to know how different partner pages perform, so we can evaluate and compare the value of a new partner vs. a potential partner.
Metrics that matter to the marketing team*
*Historical and current.
Metrics that matter to executives*
*Historical and current.
What are some examples of cohorts that you’ve built?
We’ve created cohorts based on people who open the app but then don’t use it; people that open the app, but don’t complete registration; people who open the app and do complete registrations; and those who open the app but don’t purchase cards.
“People don’t know what they want to know. As a data scientist, you need to understand people’s needs as much as you need to understand data.”
Have the metrics that you track changed over time?
Yes. Things change. For example, I used to look at registrations. Now, I see which registrations are from our VIP audience, which ones are from high school students, from university students, etc., or from CIBC. We’re getting more granularity.
In terms of tracking specific metrics, what is different about SPC Card versus companies in a similar vertical?
I think what helps us is that we’re able to take a look at action metrics. Other tools like Adobe or Google Analytics are all session-based. But Mixpanel can tell me how many of the people who looked at a page actually performed a specific action. That’s not something that you’re able to look at with other metrics platforms and that makes my role here different from my previous roles. Before, I was looking at how people moved around on a website, and now I can know information about the people who clicked on something specific. You can compare and you can make cohorts, and use this knowledge to enhance user experience. Now I’m able to know people’s specific individuals based on actions.
Does your target demographic have an impact on the metrics that you guys consider important? Compared to companies where you might have tracked millennials or older folks?
I think you’ll find that the behaviors are very different with our demographics versus an older demographic. For example, an older demographic would stay on a certain page longer, while Gen Z change their minds all the time. I think Gen Z people make decisions faster, they know that they want something, and they go forward. Older generations need to check out five different websites and make very purposeful decisions.
Does that mean that benchmarks should be different for younger audiences?
I think you need to know your audience first. I take a look at the behavior, and then I make decisions. You have to test the knowledge of your audience and look at their behavior, and then make a decision.
Have you uncovered any interesting segments by using Mixpanel?
Yes! After seeing an increase of older people on the website, we actually came to realize that we need to be marketing not only to students but to their parents, who are usually the people actually paying for SPC cards for their kids. So now we market to parents as well as to their kids, but we keep those two appeals separate.