

Data implementation, starting with the ‘why’

As a product manager, it can be a natural impulse to implement product analytics tracking on each new feature or product to understand the basic question: Is it working?
Are users adopting my new feature? Does it impact my focus metric? Does it impact my additional KPIs? These are all things PMs want to know, and questions they can use product analytics to answer by looking into engagement metrics.
But often, one major misstep is neglecting to lead with the “why” behind the question. By working to find “why” certain metrics are performing or not performing, you can answer more meaningful questions about your product or feature—and avoid getting sent in the wrong direction by shallow analysis.
o bring this concept to life, let’s take this (pretty amusing) LinkedIn post from Mixpanel Solutions Architect Kurby Chua for an example:
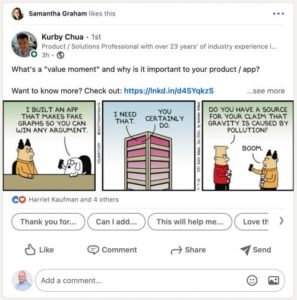
To come up with the kinds of questions I would be able to ask about this post, it seems obvious to first examine the baseline events I can track on it:
- Likes
- Comments
- Shares
- Sends
- Auto-comment suggestions used
The idea is, by tracking these events, you’ll be able to understand how many users engage, what type of engagement (e.g., likes, comments), and how this impacts them as a cohort of engaged users.
This can all be helpful information, no doubt. But far too often the “why” behind the success of a product (or a post, in this case) is found deeper than the surface-level user actions.
So in this case, my “why” would be “What’s motivating my users to engage at all on this post?”
With this in mind, I can start asking much deeper questions, such as:
- The average of likes based on how many current likes the post has (guessing there’s a golden number here)
- How likely will a user share a post that was suggested to me (a friend liked it)
- Does showing me suggested posts with a post that has no interaction make me more likely to engage on the next post as well
To answer these questions, I can add the following properties to the above events:
- Number of current comments
- Number of current likes
- Number of people shared
- Whether it was suggested on LinkedIn’s feed
After reframing, it’s easy to see that even if this post hasn’t gathered a lot of likes relative to other posts, one of the additional properties I added shows that posts that are suggested in the feed get 3x more traction than ones that aren’t. In the end, it’s not fully a question of whether the content is better or worse; it’s how it’s being distributed.
In other words, if our data analysis simply stopped at counting up specific likes and comments and then measured that against other posts, we’d hypothesize that a certain type of post (format, theme, subject matter, etc.) just gets more engagement. But by digging deeper to find more about “why” any engagement is happening on any post, we find this is not actually the case.
So the lesson here as it relates to digital products at large is that we should always seek out the “why” behind metrics we’re considering using in our analysis, especially surface engagement. It’s a great way to uncover what data is truly worth chasing.
Some parting tips to keep you on track with your event tracking:
- Talk to other PMs; it’s an easy task and we sometimes forget to do it
- Talk to other companies, mentors, CSMs for best practices
- Try thinking about what the various elements and values on the page can add to our questions
- Frame your “why” questions in a way that will make you think about the user’s actions and motivations