

Being more ‘self-serve’ using product analytics

Imagine your ideal customer discovering your product for the first time. It’s exactly the kind of tool they want to include in their tech stack. They’re eager to give it a try before they invite their teammates, so they opt for a free trial only to realize it’s not quite clear where to start.
There is no onboarding tour, help docs don’t provide the answers they need, while the response time for support is 48 hours. They give up. “Perhaps this isn’t the right tool after all,” they think to themselves as they move away, never to return.
But what if there was a simple solution that could turn this around? Instead of thousands of missed opportunities, you could get thousands of new, satisfied users. The solution is a self-serve product.
The self-serve model enables you to offer support to your users at every step of their journey, without requiring any interaction with your customer support team. This includes various types and formats of support like FAQ pages, and knowledge base or discussion forums. It also includes guided tours, in-app messaging, and easily accessible help documents.
So, how does analytics fit into this picture? Granular user segmentation and deep data analysis give you insights you need to build a better self-serve product. This enables you to empower users to succeed independently, identify friction points to offer guidance where needed, and test new ideas based on data-backed decisions. The Mixpanel + Chameleon integration provides tools for all this. Read on to learn how to put the pieces together.
How a self-serve model can boost your product success
Having well-structured self-serve support enables you to onboard users with a smooth and delightful flow, give them time and space to learn on their own, motivate them to explore and play with advanced features, and nudge them towards the “aha!” moment.
If you mix product analytics with in-product experiences you create, and you’ll get the recipe for success. For example, you can use Mixpanel and Chameleon integration to analyze product data across the entire user journey and create and sync cohorts of users for any targeting criteria. Then you can engage targeted users with in-product tours, tooltips, surveys, or checklists that offer guidance and send back event data to analyze the impact on user behavior. Rinse and repeat as many times as you need to provide contextual help when and where your users need it.
In return, an efficient self-serve model will help you to:
- Boost product adoption by announcing new features in-app to users who are most likely to be interested
- Increase customer retention by highlighting “sticky” parts of your product and offering proactive help to at-risk customers
- Enable product-led growth by identifying product-qualified leads and testing upsell and cross-sell opportunities for growth
It will also help you cut support costs by up to 24x—from an average of $6 per call and $2 per email to $0.25 for self-serve. And last but not least, it will grow your customer base, build trust and loyalty, and increase the number of product fans, advocates, and word-of-mouth referrals.
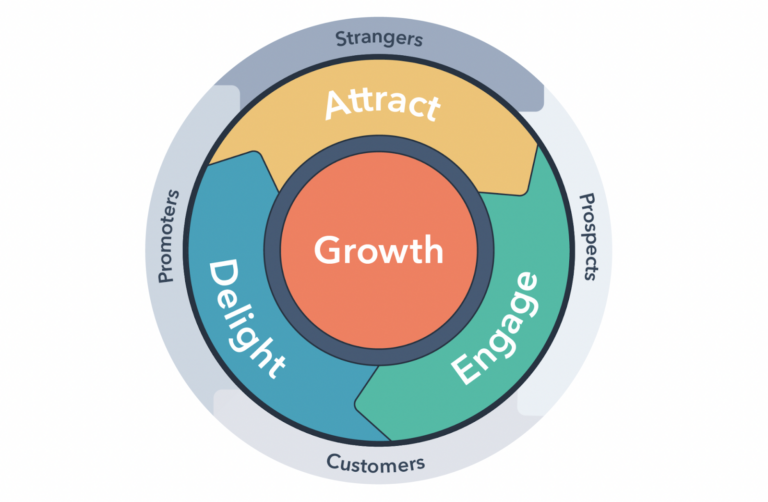
In other words, self-serve will ease the implementation of the Flywheel Model. As defined by HubSpot, this model represents the “momentum you gain when you align your entire organization around delivering a remarkable customer experience”.
Creating a self-serve platform doesn’t mean that you don’t have to offer any kind of support on your end. It means that you need to create a structured model to enable users to find answers to all the questions they might have without talking to anyone on the support team.
That also doesn’t mean that you should throw a 50-page user manual at your customers the second they sign up and start the onboarding flow, nor does it include simply pointing people in the direction of your FAQ page.
It means that you should think everything through, analyze users’ current behavior, map out the user journeys for each of your Ideal Customer Profiles (ICPs), include user story maps for different scenarios, and then offer the right answers at the right moment, and in the right place.
How product analytics can help you build a successful self-serve platform
First, choose a product analytics tool where you can track important data and extract relevant insights. Your tool stack will depend on your needs and the processes you have in place.
For example, if you have under 100K monthly tracked users and you’re still trying to find the right product-market fit, you can start with Mixpanel’s free plan to get access to relevant reports, data history, and unlimited seats. At this point, your future self-serve model will depend on your final PM fit and feedback you collect from user interviews, 1:1 testing sessions, or focus groups.
On the other hand, to build an effective self-serve model for hundreds of thousands of active users, you need an advanced product analytics tool. If you already use Mixpanel to its fullest potential, you know what we are talking about. Sophisticated analysis of in-product user behavior allows you to dive deep and see what’s happening, how often, and at what scale.
To take it a step further, you can integrate Mixpanel with Chameleon to increase activation with product tours, boost adoption with tooltips, get user feedback with in-app surveys, and offer guidance with checklists —all that with granular segmentation and deep analysis to help you evaluate your efforts and make self-serve improvements.
Now, let’s go through the process of building this model, step by step.
1. Understand how ‘self-serve’ you are
Before you start building a new self-serve model or improving the existing one, look at the numbers and data that showcase the current state.
This can include:
- The number of support tickets on a daily basis: A large number of tickets may lead to the extension of your response time, which can lead to a higher churn rate. Instead of hiring more and more customer support specialists, review the incoming tickets to find opportunities for improvement.
- Keywords your users are searching for on the FAQ page: Are some of the keywords often repeated? This may indicate a need for improving help documentation or finding another way to answer the questions related to those keywords.
- The clarity, accuracy, and relevance of your help docs and videos: If you were the one who created those docs and videos, ask your teammates to review them. They may find inconsistencies, unclear elements, or outdated information.
- The most-visited pages in your knowledge hub: This will show you the biggest friction points for your users and indicate a need for further product iteration in areas that those pages cover.
Aside from the internal review, reach out to your users and ask them about their experience, expectations, and honest feedback. You can use in-app Microsurveys to get their response while they are interacting with your product. This will help you combine qualitative and quantitative research for your future improvements.
2. Take a walk in your users’ shoes
Put yourself in your users’ shoes and start from the beginning, as if you’ve just signed up for your product for the first time. How long does it take to sign up and start a free trial? What’s happening next? Is everything clear? Is it possible that your users are feeling overwhelmed with unnecessary information at this point?
For this step, you can use friction logs to capture the end-to-end experience. This exercise will enable you to document every single action during the onboarding and write down every emotion at every step. Start completing the tasks, just like your users would, and document every detail along the way.
Next, move on to reviewing your help documents, videos, tutorials, and FAQ pages. Once again, you can use friction logging to capture the details and emotions along the way. Be sure to address some of these questions: Are the documents too long? Is everything clear enough? Is something missing? Are the answers to frequently asked questions easily accessible?
3. Identify problematic areas in your product
The next step is to gather all the relevant data about the ways your users are interacting with your product. Look at the current number of daily, weekly, and monthly active users, and start tracking their flows. You can start with these questions:
- Is there a significant drop-off during the onboarding?
- Are you satisfied with your trial-to-paid conversions?
- What is the current retention rate?
Create cohort-based views in your product analytics tool to track different user segments and their movement through different points of their journey.
If you want to understand your most engaged users, a.k.a. power users, you can measure their activity by looking into The Power User Curve. As Li Jin explained in the essay published by Andrew Chen, her fellow partner on the investing team at Andreessen Horowitz, “the curve will smile if things are good”, and it will look something like this:
Apart from measuring user activity, be sure to look into the onboarding data for new users as well. How many people have completed the onboarding successfully? Do they seem to be blocked on something, not being able to pass on to the next stage of activation? Do the same questions keep coming back to your customer support team?
With all that information at hand, define your reference points and compare current in-product behaviors to the previous events. Then, cross-reference it with your future goals. You can also compare with benchmarks from the State of Product Data report.
4. Analyze the data and extract insights
To find insights among large amounts of data more easily, generate specific reports to analyze data based on different user segments filtered by specific events, see user flows based on the paths between key actions, and measure conversion, retention, or adoption rates for segments.
By looking at cohort-based dashboards you previously created, you’ll be able to detect a pattern of behavior for each user journey, product funnel, or self-serve area. This will help you decide where to concentrate your efforts and which tactics to use for improvement.
Also, be sure to share your insights with your teams across product, support, growth, ops, engineering, sales, marketing, and other departments in your company. That way, you’ll get everyone on the same page regarding the future actions and self-serve improvements you want to implement.
5. Run experiments based upon the insights
The type, format, and timeframe of your experiments will depend on the insights you gain for each of the areas that need refinement.
Let’s take a look at a few possible scenarios.
Scenario #1: Low rate of onboarding completion
For a significant drop from new users happening before they complete the onboarding, you can try to scale down the onboarding requirements, remove friction, or offer an in-app widget with a structured onboarding checklist.
Or, you can experiment with the number of steps in the product tour. For example, run A/B tests to find out whether your users respond better to a 3-step slide-out tour activated by the page-load than to a 5-step tour anchored to specific elements on the page. While A/B testing, make sure to protect customer data.
Scenario #2: Low trial-to-paid conversion rates
For a disproportion between the number of users who start a free trial and those who continue with a paid plan, consider improving in-app messaging to drive your users to the “aha!” moment more quickly.
For example, try removing friction by adding tooltips for additional explanations, or updating the “Get Started” page with answers to all questions that might come up. You can also experiment with different formats of in-app feature announcements to keep users engaged.
Scenario #3: Low retention rates
To increase user retention, experiment with updating your help docs, recording new videos, or adding more relevant content to your help center.
Also, consider making a separate help hub for developers or starting a community-based platform to engage your users in future product roadmapping activities and motivate them to keep coming back to your product.
Don’t forget to track your experiments
Set up the tracking points for each of your experiments. For a more accurate overview, be sure to gather insights from different tools. This could mean using heat maps and screen recordings from tools like FullStory and Hotjar, support tickets from Intercom, or conversations with customers across Slack channels.
Also, leverage app integrations within your analytics tool to save time and resources. For example, you can integrate Chameleon with Mixpanel to run experiments without involving developers and then loop the data back into the Mixpanel dashboards for more insights.
Keep in mind that the change isn’t going to be visible overnight. Depending on your needs, you can review the experiment results on an ongoing basis and iterate as you go, or you can set a predefined period of time after which you will assess the new state.
6. Measure success and act upon results
After completing the experiments, go back to product analytics and look into key KPIs for success. At this point, you can compare your newly gained insights with the ones from the research and assessment phase.
Are new users able to move effortlessly through the onboarding and learn quickly what to do next, and how to do it? Have you reduced the number of support tickets? Are the new features making a bigger impact now?
If your answer is Yes – congrats, you’ve built a successful self-serve model!
Wrapping it all up
As mentioned above, building a self-serve model with the help of sophisticated analytics can certainly drive growth for your SaaS business, but don’t think of that as the only reason for creating it.
The main purpose of self-serve support is to make your users happy with your overall product experience. Give them the opportunity to learn on their own, quickly find answers to any questions, discover the real value of your product without distractions, and get clear, concise information when they need it.
So, wait no more. Go set tracking in motion, dive deep into analytics, mix and match user segments, events, and flows to better understand users’ in-product behavior, and combine qualitative and quantitative data to make better decisions. Small adjustments you make now will lead to big results over time.