


Mixpanel Account Analytics: Insights for B2B product and customer success teams

For anyone who works in B2B, you know the business rarely talks in terms of users. Rather, KPIs and business metrics are centered around the account: Are our accounts healthy? What’s our retention rate? How do we bring down churn?
At Mixpanel, we think product teams should be able to see their data the same way and connect what they do to revenue. While understanding individual user behavior is critical, being able to zoom out to the account level—and share that data with key stakeholders—is just as important.
Go beyond the user with Mixpanel Account Analytics
That’s why we’ve built Account Analytics, a set of features built specifically to help you go beyond individual user behavior and optimize your B2B product. With Account Analytics, you can:
- Share profiles for every account: Answer questions for strategic accounts with auto-generated profiles, including usage, top users, and retention.
- Drive adoption and reduce churn: Track activation progress by analyzing accounts by user-level behavior, create churn risk alerts, and monitor account health.
- Compare behavior across accounts: Analyze account-level product adoption, progress through a funnel, and break down your data by account properties.
- Tie account behavior to business outcomes: Connect revenue data from your data warehouse to understand how account-level behavior is impacting the bottom line.
*Mixpanel Group Analytics add-on required for Account Analytics features
Account Analytics is built on top of our Group Analytics functionality, and encompasses four key product capabilities, starting with Account Profiles.
Uncover and share insights for every account with auto-generated Account Profiles
Account Profiles are a type of Group Profile that comes with auto-generated reports for analyzing the behavior of each of your accounts. Instead of manually creating individualized boards for every account—a non-starter for most companies who have hundreds or thousands of accounts. You can open your Account Profile and immediately find insights into key metrics as shown here:
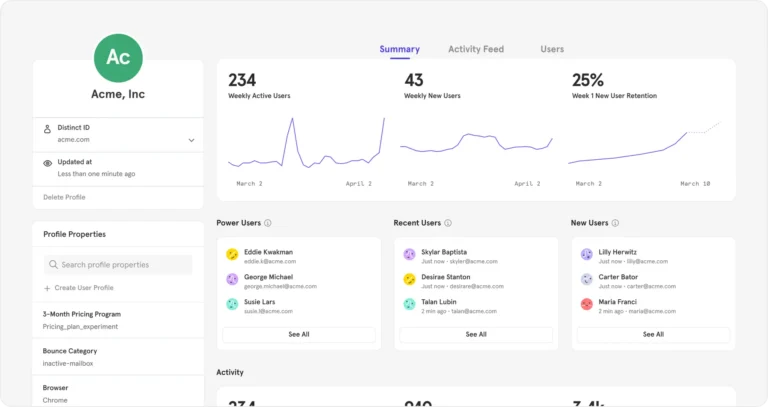
Using these profiles, you can quickly dig into the adoption of strategic accounts, identify power users or new users in the account for targeted Session Replay viewing, easily present to executives on performance of key accounts, and share with relevant stakeholders, such as customer success teams for account health monitoring.
You can see more on how Mixpanel uses Account Analytics to monitor account health and help our customer success teams here.
Drive adoption and reduce churn with Activation Metrics
“What is the number of trial accounts that have more than two active users?”
B2B teams must think at the user and account-level, which means they have to be able to run analyses on accounts based on user-level behavior. With Activation Metrics, you can query “Number of users who did an action,” aggregated on an Account basis. This makes it easy to accomplish key B2B use cases, such as tracking activation progress by analyzing accounts with a certain number of users who have completed an event.
For example, you can answer queries like:
- Show me accounts where users have “logged in” more than 10 times
- Or, only show me accounts with more than 2 “active users”
- Then you can add even more filters, such as only looking at active accounts in a specific segment (e.g., industry, company size, etc.)
- Then you can add even more filters, such as only looking at active accounts in a specific segment (e.g., industry, company size, etc.)
- Then you can add even more filters, such as only looking at active accounts in a specific segment (e.g., industry, company size, etc.)
- Then you can add even more filters, such as only looking at active accounts in a specific segment (e.g., industry, company size, etc.)
This enables B2B teams to easily track account activation, get ahead of churn risk accounts, and run more sophisticated analyses on your overall account health.
Compare behavior across accounts and segment by Group Properties
Once you’ve created Accounts using Group Analytics, you can also apply Group Properties to any account profile. This helps you break down your analyses in any report, board, or cohort in Mixpanel. Group Properties are a collection of properties and event history specific to a group (similar to User Profiles Properties at the user level), such as:
- Name
- Industry
- Number of employees
- Features used
- Subscription type
- And more, depending on what's relevant to your business
Combined with Mixpane’s deep analytics features, you can accomplish a wide variety of B2B use cases.
For example, if you’ve applied Industry and Subscription Type properties to your accounts, you can then create account cohorts based on those properties (e.g., a cohort for your strategic industries, or cohorts for accounts on different plan types). You can then run comparative analyses using these cohorts—e.g., seeing which accounts by industry are engaged with a new feature, and how.
You could also use properties to filter and breakdown existing reports and boards by account properties, making it easy to do ad-hoc diagnosis for understanding the underlying properties that are affecting account-level behavior.
Connect revenue data from your data warehouse and account-level behavioral data with Revenue Analytics
While any product team should be connecting their behavioral data to revenue, it’s particularly critical for B2B teams to be able to see that impact at the account-level. While user growth can be analogous to revenue growth for B2C, B2B teams need to understand the behavior of their highest revenue accounts.
At the most basic level, they should be able to answer the following key questions while being empowered to drive decisions quickly and measure their impact:
- “How has our initiative impacted new account revenue?”
- “What % revenue is adopting this new feature? Why has LTV reduced? Is it mainly the SMB or Enterprise segment? Which account segments are driving it? What are our hypotheses on what we should do to solve this?”
Mixpanel's Revenue Analytics enables you to connect product, marketing, and revenue data for multi-metric insights in one self-serve analytics platform, giving you a clear picture of how your product is impacting your bottom line. We support revenue analytics for all business models, specifically transaction and subscription-based businesses. For B2B subscription businesses specifically, you can track:
- ARR Growth Rate
- ARR Churn Rate
- ARR by new, upsell, downgrade
- Average Deal Size
- Net Revenue Retention
- Expansion Rate
To ensure 100% accurate revenue data, we recommend that you integrate Mixpanel with your data warehouse (Snowflake, BigQuery, Databricks, Amazon Redshift, etc.). For added peace of mind, you can also set up Data Views, where you can filter revenue related data to only approved users with access to Data View, including revenue numbers. For more details on Revenue Analytics, check out:
- Q&A with Mixpanel Product Manager, Neha Nathan
- The best revenue metrics to track
- Demo Board created with our B2B SaaS template
Wilco doubles its activation rate with Mixpanel
After Wilco switched to Mixpanel, they saw a dramatic improvement in their user activation rate. By leveraging Mixpanel's Flows and Funnels features, Wilco was able to:
- 2x user activation rate through data-driven optimizations to their user onboarding process.
- Reduce onboarding time from 1+ days to just 9 minutes by analyzing user behavior and identifying areas for improvement in their onboarding flow.
- Sped up time to build a board from 3-4 days to seconds.
“We experienced those results by simply looking at the data in Mixpanel over time, which translated into interactive product changes, and now users are getting hooked on the platform more easily.”
DocuSign accelerates growth of its 100-million strong user base
By leveraging Mixpanel's Funnels and Insights reports, DocuSign was able to:
- Increase account creation by 15% through A/B testing and targeted campaigns based on user behavior.
- Boost signer-to-sender conversions by 19% by understanding user journeys and optimizing key interactions.
- Expose gated premium features based on user likelihood to convert, effectively driving adoption of paid features.
“What started as a need for simple marketing metrics turned into custom product metrics for more than 100 different stakeholders across the company.”
Try Account Analytics today
Experience all this functionality today by requesting a demo of Account Analytics. If you're already a customer and have Group Analytics enabled, you can get started right away. If not, please contact your account representative for more information.