

Introducing Signal

You have assumptions about why your users come and go. You believe that if they do this specific thing, they’ll become a loyal and active user. If they don’t, they won’t. While your intuition is likely on the right track, more specifics lead to better results for your product.
A well-known example is Facebook’s finding that “seven friends in 10 days” almost always leads to a long-term user. In your gut, you know that adding friends is valuable, but you couldn’t possibly be that specific without crunching some numbers.
And while adding friends might have been a big factor leading to retention, there surely are others. But how do you find them?
That’s why we built Signal.
Signal helps you find user behaviors that correlate to higher retention and engagement, leaving the complicated math to Mixpanel. It’s the latest addition to our suite of products that automates insights for you.
Let the data science team be
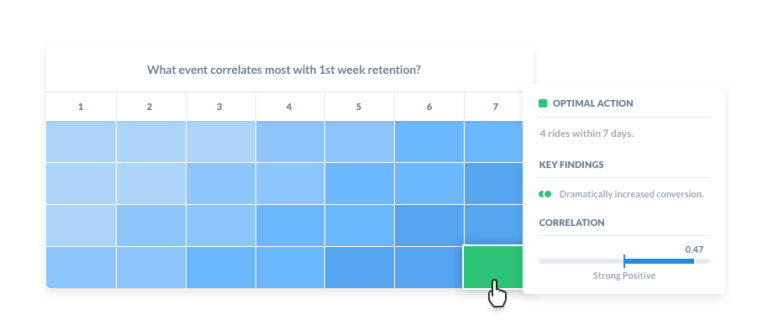
We always aim to take the guesswork out of hitting your product goals. With Signal, you can validate your assumptions and identify specific user behaviors that will lead to higher retention or whatever it is that you care about.By viewing how your top events correlate with your goal, you can even discover opportunities you might’ve missed otherwise.
Of course, with some modeling, you or your data science team could crunch these numbers and find strong correlations. But with Signal, you can stress-test your assumptions in mere minutes. That means getting ahead on building your product, and allowing the data scientists get back to their most pressing issues.
And since a data scientist would never throw a chart on your desk without explaining its significance, Signal won’t either. Instead of just spitting out a raw correlation number, Signal recommends where to take action and where to hold off. Each result comes with a Key Finding, which tells you how this event impacts conversion and how often users are doing. This type of insight helps eliminate false positives and surface hidden drivers of retention.
With Signal validating your assumptions (or not) in an easily interpretable way, you can get back to building things with confidence and your analysts can focus on other things.
How do I use it?
If you’re a Mixpanel user, you already have access to Signal under the Engagement tab.
Go into the report and start by seeing how “Your Top Events” are correlated with 2nd Week Retention. This query will calculate a list of optimal actions for users to take and analyze the statistical relationship between them and 2nd Week Retention. Some of these may be no-brainers. Some of them may surprise you. Either way, you’ve already got a laundry list of user actions to lean into or limit.
As you ask more complex questions about your user journey, you can adjust the events, time frame, and user groups within Signal to quickly confirm or refute long-held assumptions. Who knows? Maybe you’ll discover a couple of aha moments in your own product. For more information, check out our documentation.