We’re making it simpler and faster than ever to get started with Mixpanel
It only takes 5 minutes to get started with Mixpanel. We think that’s important because onboarding a new analytics tool has traditionally been time-consuming, overwhelming, and confusing. We know you don’t really have the time for that, so you won’t find a more “instant” and user-friendly analytics solution than Mixpanel.
But still, we’re always striving to add more simplicity and support in our onboarding and implementation processes. So the latest updates we’re making are particularly big for helping our users across different technical levels go from data to sophisticated dashboards faster than ever.
They focus on the two biggest parts of getting Mixpanel off the ground: tracking data and visualizing that data.

Building your tracking plan
Tracking everything and anything your user can do in your product can lead to unnecessary development effort and unused data. It’s important to have a clear and defined plan when implementing Mixpanel, so to help, we’ve traditionally offered industry-specific tracking plans. There are mixed reviews of today’s process.
Pros:
- Breakdown of what you need to track to get started
- Recommends events and properties
- Guides for six different industries
- Publicly available
Cons:
- Can be confusing for non-technical users
- Not the smoothest communication between non-technical user and developer
- Can be overwhelming with so many recommended events to start with
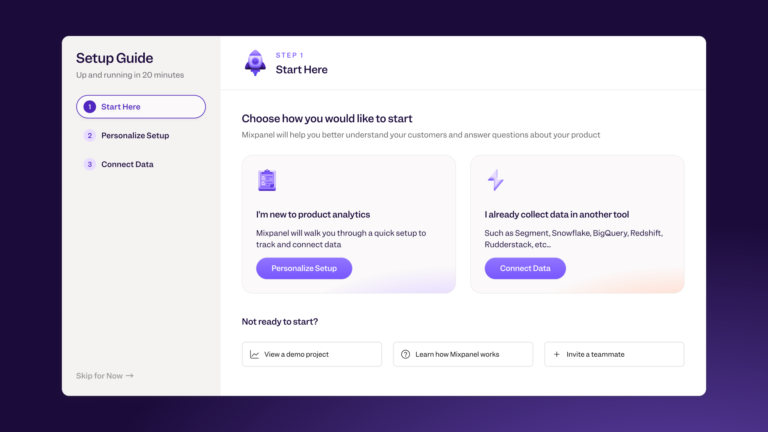
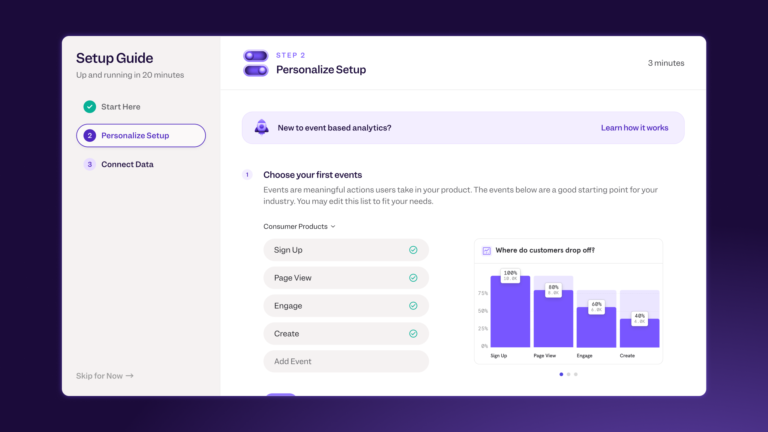
Our new onboarding flow guides you through an easy selection process of building the right plan for you and your team, focusing on the moments in your product you want to monitor and the insights you’re looking for. And if you’re not an engineer, don’t worry: We include a way to input your preferences and send them to the developer on your team who will actually connect the data.

This change not only helps you get through the “data in” setup in a simpler way, but it also helps ensure you’re starting off with the best possible tracking plan.
Bringing data to life instantly
When it comes to visualizing that data, we’ve made a couple of significant strides. We heard calls for low-click to no-click insights and answered with our Starter Board.
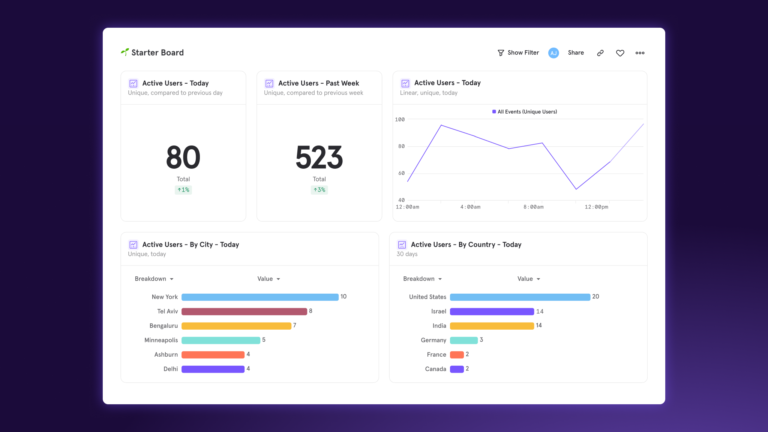
When a user joins Mixpanel, a Starter Board for them—a dashboard with key metrics—is automatically generated as soon as data is sent to Mixpanel. No work needed—instant analytics.

This ensures everyone can get insights from their very first session in Mixpanel. Our Starter Board focuses on primary areas that are essential for digging into product growth:
- Daily active users
- Weekly active users
- Daily active users over time
- Active users by city
- Active users by country
- One week retention
- One week retention over time
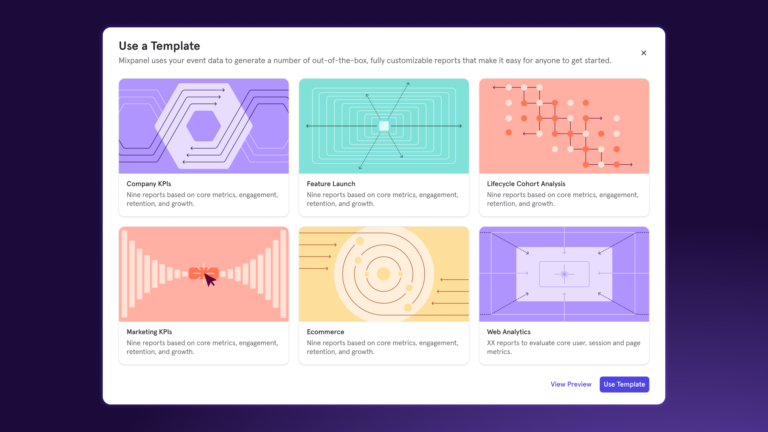
Want to go deeper? Our ready-made templates are a high-impact, low-effort way to launch into the full analysis power of Mixpanel. With just a few clicks, you can create fully built-out Boards to analyze everything from user lifecycle to key company KPIs and feature launches. You can also go wider and dive into marketing and industry-specific templates. And since template Boards can be edited and iterated after creation, they can be a big help to analytics beginners and power users alike.

With our Starter Board and templates, we’re removing even more of the learning curve and getting you to insights as soon as data is connected.
What’s next?
Our commitment to improving the onboarding experience doesn’t end once a user signs up. We believe in the importance of continuous iteration and improvement, whether it’s adding a new template or making it easier to get trustworthy data into Mixpanel. A lot of these improvements come out of user testing and feedback.
We’d love to have you give Mixpanel a try and let us know what you think. After all, it only takes 5 minutes to get started.


