

Top 6 customer retention metrics

When a product doesn’t have good customer retention, it’s like working with a leaky bucket.
Without existing customers coming back to your product, sustainable growth and revenue become much harder. Even more, a satisfied customer who continues to use your product is more likely to recommend it to others. Bain & Company found that a 5% increase in customer retention can lead to a 25-95% increase in revenue.
Product analytics makes tracking customer retention much easier. With granular and targeted metrics, you can find where and why customers are staying with your product or service and why they may be leaving.
Here are seven key customer retention metrics that you’re going to want to see trend in the right direction in your product analytics.
Customer retention rate
The most important metric for customer retention, understandably, is customer retention rate. This metric tracks how many customers stay with your product over a period of time. The customer retention rate serves as a good overview of how loyal your customers are.
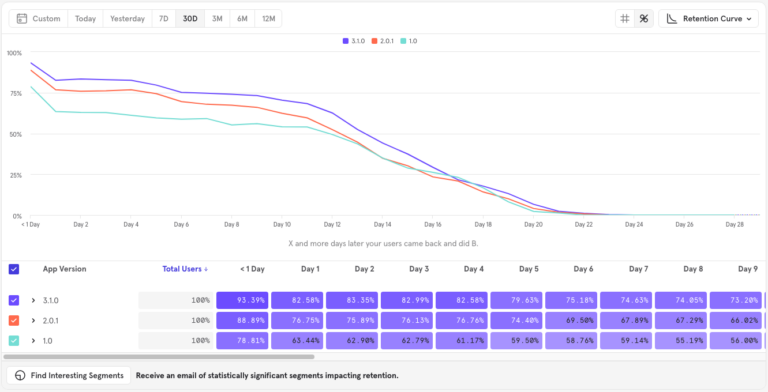
For added insight, you can break down customer retention according to different cohorts and experiences. For example, you can track if customers from France are staying with the product compared to those from the United States.
Churn rate
Churn rate is another metric of customer retention, this time focusing on how many customers are actively leaving. While some degree of churn can be normal for a product, it’s important to not let churn get out of control.
Measuring churn rate can be done in several different ways, but they typically center around measuring how many customers left a product divided by total customers (it’s the inverse of retention rate).
The unit of measurement can vary. Many companies use churn rate just to track how many users are leaving, but if your product has free and paid tiers, you can track the percentage of customers that are downgrading as some form of churn.
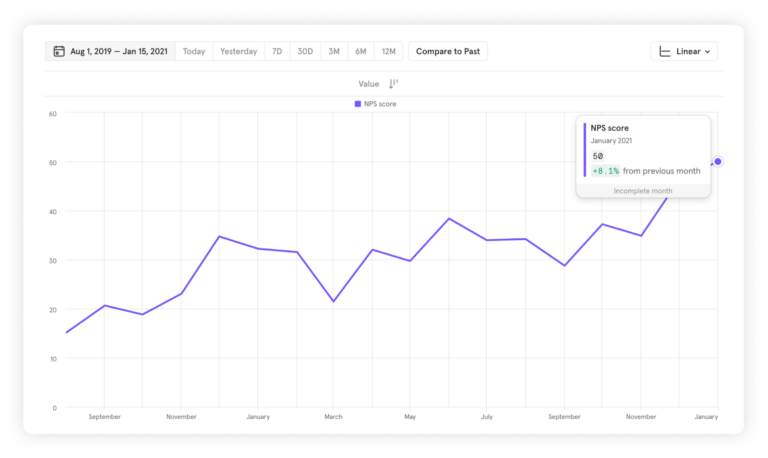
Net promoter score (NPS)
While it sounds opaque, net promoter score is tethered to one key question: How likely is a customer to recommend your product to others? You’ve definitely seen this question in any customer feedback survey at an online store, and it remains a core component of customer retention. If a customer wants to recommend your product, they are likely to stick around as a retained customer.
Reactivation rate
Similar to reconnecting with that $20 bill you left in your pocket after doing laundry, it’s always a joy when customers return to your product or service. Typically, reactivating an account requires some kind of form submission, so you can use product analytics to track how often customers are returning. With this information, you can see how your actions affect customers returning and eventually staying with your product.
You can combine reactivation rates with other metrics and cohorts to fully learn where and why your customers lost their way.
Repeat purchase rate
Repeat customers are generally more loyal and willing to refer others. The better your repeat purchase rate, the more satisfied your customers likely are. If customer retention is a top-level goal, getting a repeat purchase becomes a major milestone along the way to retention. To track repeat purchase rate, you can calculate the number of repeat customers compared to the total number of buyers or first-time buyers. This stat can also be translated outside of strict “purchases” to other events like appointment signups.
Time to value moments
How soon customers get to their first value moments in your product can be a strong indicator of how likely they are to retain.
In a blog post for Mixpanel, Roam Digital’s VP of Product offered the example of an analysis product she worked on seeing much greater retention with customers who added a minimum of three tools to their dashboard shortly after getting started.
After work is done to determine what customer value moments connect best to retention on your app (e.g. streaming three videos or booking two rideshare rides), a “time to value” metric can be super important to track.
Customer retention isn’t an exact science, but tracking these metrics will help your team prioritize and strategize on how to retain users.