

User interviews and product analytics

As a product leader at Mixpanel, I can go on and on about the value of using product analytics in my work. (And I have.) But that doesn’t mean I don’t understand how important user interviews can be for learning how people use my products.
Combining product analytics and user interviews for product development is not exactly a novel approach, but what I’ve found is that choosing when to employ which method, and how to make sense of all the data you get, can be the real key to success.
Below are some of my best practices on wielding these two tools together, with a little added guidance on avoiding common misfires.
Why use both user interviews and product analytics?
To get into how to balance product analytics with user feedback, I’ll start with a bit more on why I, wonky Mixpanel guy, believes both are very important.
It’s a product team’s job to understand customer pain points and identify opportunities to solve them, and the two data-gathering methods we’re talking about often aid in these processes in different—and complementary—ways. User interviews are best for deep-diving into a problem with a customer. You get to ask questions and observe both their responses and their actions. Product analytics, on the other hand, is looking at user behavioral patterns in aggregate.
Both methods can identify signals for what problems exist in a customer journey, while analytics can help you decide which problems to prioritize and interviews are uniquely suited to gather ideas of why something is a problem for a user.
The “flow state” of user interviews and analytics for solution-building
The same kind of combination of user interviews and analytics used to get your product problem hypothesis can often lead you to a solution hypothesis. From there, if you want to capture a quick sense of whether the solution hypothesis is directionally correct before you actually build the solution, user interviews are your friend. Quite often, our design team members would build a quick Figma prototype with 1-3 options and get some users to walk through the prototype while doing tasks.
It’s not sustainable to rely on product analytics at this stage; you’d still have to build some variation of an MVP, which often takes more time than Figma prototypes and calls.

But analytics come in the next stage. Let’s say that you’ve rolled out a solution hypothesis into your live product and want to know whether that has solved the problem you were looking to solve. Again, you have to rely on analytics to get that aggregate view.
In a phrase: User interviews show you what users say they’ll do (and what they experience), but product analytics capture what users actually do.
So, you need both. First one, and then the other, and then the other again… and so on.
What to watch out for when using both methods
Alright, alright, you get it: Including both user interviews and product analytics together is important. But what are some of the ways that people get things wrong?
Setting yourself up for analysis paralysis
An issue I often see customers run into stems from something I have been often guilty of as a product lead: pulling in too many metrics and making multiple pivots on a particular metric to make my decisions.
It’s tempting to slice and dice the data in that “perfect” way, or to substitute one metric for another when you’re not getting the clarity you thought you’d get.
As I mentioned above, you do need multiple metrics to make strategic decisions. But be cognizant of pulling too many in. (Just how many depends on your desired outcome—I’m happy to chat.)
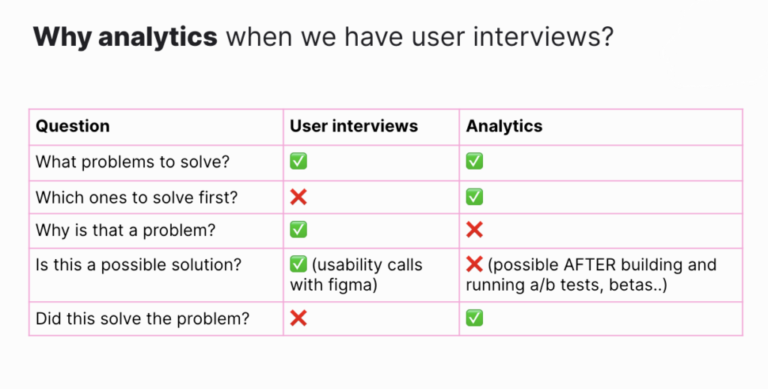
To avoid analysis paralysis when using both user interviews and product analytics, be clear about which approach will give you the best insight for each stage of your product-centered problem solving. (The chart above will help.)
- What problem? Focus on user interviews and validate with analytics.
- What’s the priority? Use product analytics to determine which problems identified by users are experienced by the most amount of users, prioritize from there.
- Why is it a problem? This is a qualitative (but important) step, validated by deep user interviews.
- What’s the possible solution? Again, you’ll need qualitative feedback from users to identify potential solutions, unless you want to build out MVPs.
- Did the update solve the problem? After you build, the only way to aggregate the user response is through product analytics.
Focusing on vanity metrics
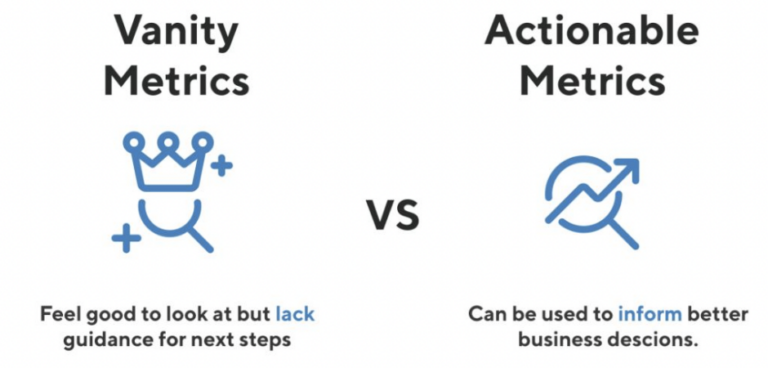
Want to make sure your user research or analytics come back to show zero problems in your product? One (not advisable) way I’ve seen product managers ensure this happens is by fixating on metrics that make them look really good—as opposed to metrics tied to actual customer value. There’s a known phrase for these measurements, from demand marketing to product analytics: vanity metrics.
For example: Yelp might get excited about the number of app downloads, but just getting a bunch of app downloads does not make for a true value exchange. Instead, Yelp needs to combine that metric with the number of activations, the number of reviews left, reservations made, and so on. (Remember when I said product analytics let you take an aggregate view? The same goes for painting a bigger picture across metrics.)
The good news is you can focus on actionable metrics from both user interviews and product analytics. The bad news is it’s easy to resort to vanity metrics in both approaches, too. To avoid vanity metrics in user interviews, open-ended questions work well. To avoid them in analytics, focus on the prioritization of your problem-solving and whether or not your changes solved the problem.
Getting led to counterproductive metrics
While vanity metrics can be a construct of a product team (of which they should know better to avoid), there is also no shortage of mirage metrics that your interview or analytics data can lead you to if you’re not vigilant.
Story time: During British rule in India, the British government was worried about how many cobras in Delhi. Naturally, they started offering a bounty for dead cobras.
At the outset, it seemed like a success: A huge amount of venomous snakes were killed. But what the British government didn’t realize is that people had started breeding cobras in order to collect the reward. The program was scrapped once they found out, but then the cobra population increased dramatically as the breeders started setting their snakes free.
This is a classic example of having the right intention, but having a first-blush look at a problem hypothesis, solution hypothesis, and early resulting data lead to the wrong metric. It created misaligned incentives, which in turn created the wrong outcome.
Picking the right metrics, aligned with incentives and outcomes, is tricky. But I recommend keeping two things in mind:
- Make sure you’re not thinking about too many metrics together (see analysis paralysis above).
- Vet out the “second order” effects of the metrics you choose through interviews and analytics if you can. Make sure, like the cobra effect, you aren’t setting yourself up with misaligned incentives.
Bringing it all together with a focus metric
One of the most important pieces of bringing together both user interviews and product analytics is to pick a focus metric that you can keep coming back to.
There’s a reason most teams call this the North Star metric: It’s the metric that is supposed to be predictive of your company’s long-term success. It’s the metric that aligns different teams along both the strategic and tactical front. And (bringing this all back to the beginning) it’s the metric that captures the true value your customers are getting from the product.
For Netflix and YouTube, it could be time spent watching videos. For Dropbox and Google Drive, it could be the number of files stored.
For Mixpanel, it’s the number of learning actions (like a segmentation) that a user runs each week. We tweak and make fixes, but if an update doesn’t feed into that focus metric, it doesn’t matter whether we got validation from user interviews or analytics.
All of that is to say: If you’re worried about balancing user interviews and product analytics, err on the side of bringing your measurement back to the value your product gives your customers.
That approach will ensure you’re employing both tools in the best ways possible and avoiding a number of pitfalls, from vanity metrics to premature celebrations.