

Visualizing your customer’s support experience through Mixpanel

In 2021, we started reviewing Mixpanel support ticket metrics with … Mixpanel. Here’s an outline of how we approached it, our reasoning for why we wanted to do it, and the value we are getting out of the implementation.
What: Defining our metrics and what to track
Any analytics implementation should start with the set of North Star metrics that are relevant for the company and departments. In Mixpanel’s support team, as it happens in nearly all organizations, we have many goals at a given point in time, but with improving customer experience as the theme, as well as for simplification purposes, we focused on three strategic metrics and three operational ones.
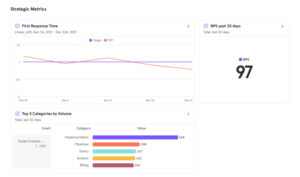
Strategic metrics
- 90th percentile (p90) on first response time (FRT): This is measured as the time it takes for 90% of the tickets in a given period to get an initial reply from our team.
- Average net promoter score (NPS): This is measured as the average score on Ticket Solved events.
- Top 10 categories: This is cross-organizational and made up of the volume of Ticket Created events broken down by ticket category—and then pulling out the the top 10 from that.
Note: This is meant to be shared with the product team to help drive prioritizations. Ticket volume on its own could be a lead indicator. That being said, it can be weighted by revenue and ticket urgency/impact, instead of just sheer ticket volume, in order to review the categories that have could have the highest impact.
Operational metrics
- Weekly and monthly created tickets: Pretty simply, this is the volume of weekly and monthly tickets being created.
- Time to escalation response: This is the average time from a ticket being escalated until the response by the escalation agent.
- “My” daily tickets: This is the volume of tickets picked by a specific support engineer daily.
Note: Both weekly/monthly volumes and escalation times are used for capacity planning while “my” daily tickets is more of an individual metric that gives each support engineer their own dashboard with the volume of types of tickets they are working on.
The metrics need to be translated into specific events and properties to be tracked. A sample implementation layout for those metrics above can be found in this link.
Why did we want to visualize Zendesk data within Mixpanel?
Before continuing with how to implement, it’s important to state the motivation in visualizing the metrics through Mixpanel since, at a glance, it might feel like re-inventing the wheel. Zendesk does, for instance, offer a very capable reporting offering and Mixpanel is mainly geared towards product analytics. This could be summarized into two reasons.
Visualizing metrics that are more meaningful to our goals
We wanted to make sure we could analyze the metrics that mattered the most to our team. One, in particular, was the p90 on (FRT). Zendesk, of course, already provides a way to review the FRT for a ticket, as well as the median and averages. For quite a while, we measured average FRT as part of our metrics, but a challenge that arose was that while the average was within a given predictable range, a non-trivial number of requests were being replied to quicker than the average, while others took quite a bit longer. This meant that the average was skewed at both ends and not necessarily representative of the overall customer experience.
In order to reduce this noise and make sure we kept an eye on a more comprehensive view of the experience for response times, we decided to shift from median and average reply times to measuring the p90. The goal would be to measure what was the response time under which 90% of all incoming requests for a period of time were being answered. Luckily, measuring percentiles (p25, median, p75, p90, and p99) is already baked into Mixpanel.
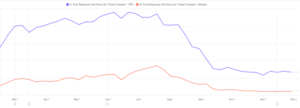
The image above tells the story: The orange line represents the median FRT, the purple one represents p90, and the gap in between represents the difference in wait times between half the requests vs the top 10% that take the longest to reply to. As time progresses, we measure and adjusted with multiple initiatives. As a result, we can see the trend over time of the overall customer experience getting closer within most of the spectrum.
Easier to share and adopt across the organization
Having insights on response times, resolution times, and NPS are great tools to have within the support team to better the experience we provide. But in order to maximize the impact on customer experience, ideally, we want to empower the product team with data on trends from customer feedback or just sheer volume counts to assist in the planning and prioritization process. Said in a different way, we want the product and accounts team to be informed on why customers are writing in.
Since everyone at the company already knows how to use our product, how to set up dashboards, and how to do explorative analysis on datasets using our reports, a way to minimize friction and promote the use of the data is to place it in the tool everyone on our end already knows and understands within the company.
Enough talk! How do I send this data to Mixpanel?
There are a number of ways to make this happen, and we will cover a minimal-tools-required approach, but essentially, the best way to proceed would be dependent on your data ecosystem. As an example, some organizations may already have their Zendesk data in a data warehouse (DW) in order to be able to cross-reference with other internal data. In that case, a great strategy is to start from that centralized data in your DW and leverage a tool like Census that can sync it to your Mixpanel project.
As a general idea, having your data centralized and cleaned in a DW and then pushing it to Mixpanel for visualization is a great way to go.
Having covered that, the approach we want to cover here assumes no additional tools and minimal infrastructure required. The layout of the implementation would be:
- Create a Zendesk Webhook; this allows you to send data/payloads in response to triggers and automation. The webhook can be directly pointed to Mixpanel’s data ingestion endpoint at https://api.mixpanel.com (or https://api-eu.mixpanel.com if your project is set up for EU data residency).
- Create some Zendesk Triggers. The webhook describes where the data should be sent, but now we need to define what data and when it should be sent. Based on our events to track, it would be sufficient to create three triggers:
1. Trigger filtering for when tickets are created
2. Trigger filtering for tickets being updated and containing a public reply
3. Trigger filtering for tickets being updated when changed to a relevant status (pending/hold/solved) - Create a script that pulls data from Zendesk’s ticket metric events API to get both first response and full resolution times.
Covering points 1 and 2 would get us most of our metrics and would directly be sent from Zendesk. The gap they have is FRT and full response time, as those values would not be available in the trigger. That being said, since this is a metric we don’t need real-time access on for dashboards, the script in step 3 can take care of extracting this data, say, once a day. You can have this script running in a local machine or even just publish it to a cloud platform like Google Cloud Platform or AWS on something like a cloud function.
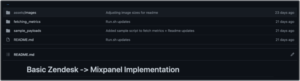
For a much more detailed review of the steps, we’ve laid out all the details in this GitHub repository.
Privacy in mind
We didn’t want to close the conversation without covering privacy. It’s more than a cliché by now, but it holds true that with great power comes great responsibility (a quote from Marvel Comics). Given that Zendesk can potentially hold sensitive/private data from our customers, we want to make sure that the design of data coming in only includes the general data information we need for our metrics and no more.
A few tips/best practices would be:
- Do NOT include ticket subjects or contents in the tracked data. While it could potentially be useful for keyword searching, the possible drawbacks of sensitive data being ingested far outweigh the benefit, so it’s best to leave it out. You can track a category field and tags instead.
- Consider only tracking the organization that requested the ticket instead of the email of the requester. If you’d like to track the request (to have metrics like the average requesters per org), you can have a separate process that updates the profile and hashes the email. By doing this, you can still count uniques while not having to keep the email.
- Start minimally and add more data if required. With only two events—Ticket Created and Ticket Updated—along with the category of the ticket status, who it was assigned to, and the response time, you can fill a dashboard with a lot of great metrics and barely send any data. You can always add as needed, but it’s great to question whether it could potentially be considered private/sensitive information.
Happy analyzing!