A decade with product analytics: How Vivino’s data culture and processes have aged like fine wine
Deepening quantitative analysis over time
Before Mixpanel, we had no proper way to do quantitative analytics. We did user testing and used some basic tools for A/B testing, but we didn’t have any good ways to analyze that data. And anything that we were able to analyze we could only look at in a very specific context. So maybe we could measure the impact of a specific feature, but that was the end of it.
The benefit we got with Mixpanel was that once we started tracking lots of events, we could look at things from angles that we hadn’t even thought of before. It gives us more flexibility, and we can look at user journeys in different ways. We’re not tied to our preconceived notions.
When you have a powerful analytics solution, you’re not as contained in your analysis. You can look at a problem from 100 different angles, and you don’t need to define all of those parameters upfront, as long as you have a good event tracking practice.
Downstream effects create the need for counter-metrics
The complexity of our product and revenue streams means that influencing user behavior in one direction can have an unintended detrimental effect on other parts of the user journey.
For example, Vivino’s wine page—a primary landing point for users scanning a wine label—serves multiple goals, from encouraging purchases to offering deeper wine insights through our Premium subscription. Emphasizing buy-now options can drive immediate sales, but it may draw attention away from Premium features, impacting signups. Mixpanel helps us track these downstream impacts, making it easier for teams to align their goals without losing sight of broader company objectives.
Sparking questions for qualitative analysis
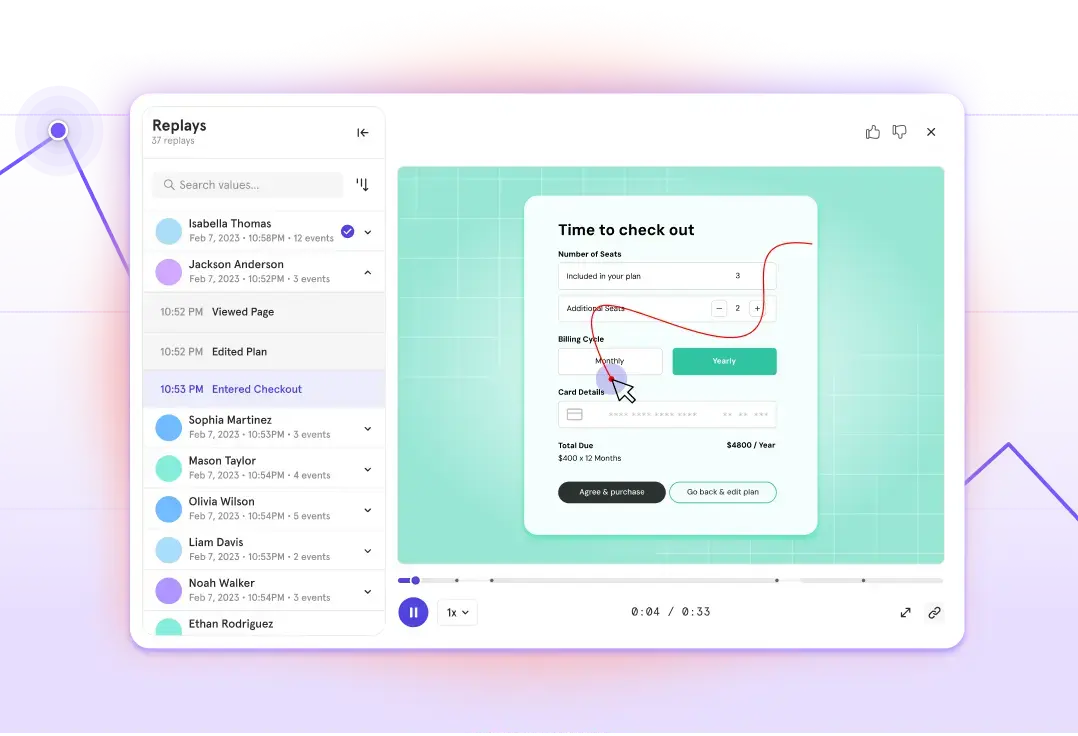
On top of quantitative analysis, Mixpanel has allowed us to go deeper with our qualitative analysis. Mixpanel is great at generating questions that we can follow up on through user interviews. When we see odd user behavior, we can dive deeper in Mixpanel and build a hypothesis of why that’s happening. But it can also be a sign that we need to speak to our users to understand why they’re doing certain actions.
Mixpanel is great at making us realize that our assumptions are wrong.
Sharing metrics and results across the company
We use Mixpanel more for internal communication now than when we started. In the earlier days, 99% of our usage was one-off analysis or answering a specific question. It was very isolated to product managers.
Now, we leverage more of the functionality within Mixpanel to convey how something is performing and what we’re seeing. We’ve become better at using dashboards and sharing those with the rest of the organization, and that’s been quite helpful. It allows us to convey why we’ve made certain decisions and how the data supports us.
Getting engineers more involved in strategy
We’ve seen the benefits of fostering a culture where our engineers are more involved in our analytics planning, in seeing the effects of what they’re building and understanding why we’re tracking what we’re tracking. We don’t want our engineers to just implement events without thinking about how the data is going to be used or if there are better ways to do it.
Once our engineers started understanding the benefits of Mixpanel, we started to see improvement in how we as a team think about events, what we track, and how we track it.
Detecting anomalies faster
Another Mixpanel use that has been super helpful for us is detecting anomalies that would normally get lost in the noise.
We have a lot of engagement and a lot of active users. But most of those don’t buy with us, and that can sometimes drown out problems, especially at the bottom of the purchase funnel.
For example, we sell wine in 22 countries. We had an issue with checkout in our UK market, and users couldn’t complete the purchase. If you have an issue at the very end of a funnel, the business impact is disproportionate to the number of users it affects. If it only affects 100 events, it can be very difficult to notice. But it’s critical to fix those quickly because all 100 of those were monetizable events.
That’s where Mixpanel can be very helpful. If you understand your user journeys, you’re able to pinpoint certain critical journeys and monitor those so you can react to potential issues there faster.
Bringing in business data to enrich product and user analysis
One of the more impactful changes we’ve made in recent years was to start joining our product usage data in Mixpanel with our Redshift data warehouse data—like order revenue from wine purchases, subscription plans, and advertising streams—to get a clearer view of each product user's lifetime value on Vivino.
Enriching our event data with these revenue insights helps us understand user behaviors more widely and comprehensively. It’s a far cry from where Vivino was with quantitative data analysis a decade ago, and with the continued help of Mixpanel, we’re very excited to keep pushing forward.


