

What are app analytics?

With app analytics, you can answer questions, like:
- Which of my features are most popular?
- How many daily and monthly active users do I have?
- Who are my power users?
- What is my retention rate?
- What percentage of users activate and then purchase a paid plan?
- Why are my product KPIs declining (or growing)?
App analytics vs. web analytics
Web analytics software has been around since the early 2000s and became mainstream in 2005 when Google purchased a company called Urchin, then relaunched the product as Google Analytics. Web analytics tools are built around the core measurement unit of the “page view.” On a website, each page has a distinct URL, and when a visitor navigates from page to page, the activity is tracked and made available for analysis.
Applications, whether mobile or web, are engineered in an entirely different way than websites. Common activities within an app, such as swiping, searching, and “liking” cannot be represented by a “page view.” These user actions are often referred to as “events.”
This distinction, and the rapid increase in the number of applications, led to the creation of a new category of analytics tools built on the “events” data model. This includes products like Mixpanel, which are often referred to as app analytics (or product analytics), given that their architecture is tailor-made for application analysis.
Common types of analysis done with app analytics products
Product managers are typically responsible for making apps successful, in collaboration with the engineering and user experience teams that they work with. Mixpanel conducted a global survey of over 450 product managers, asking them the questions they’re hoping to answer with analytics.
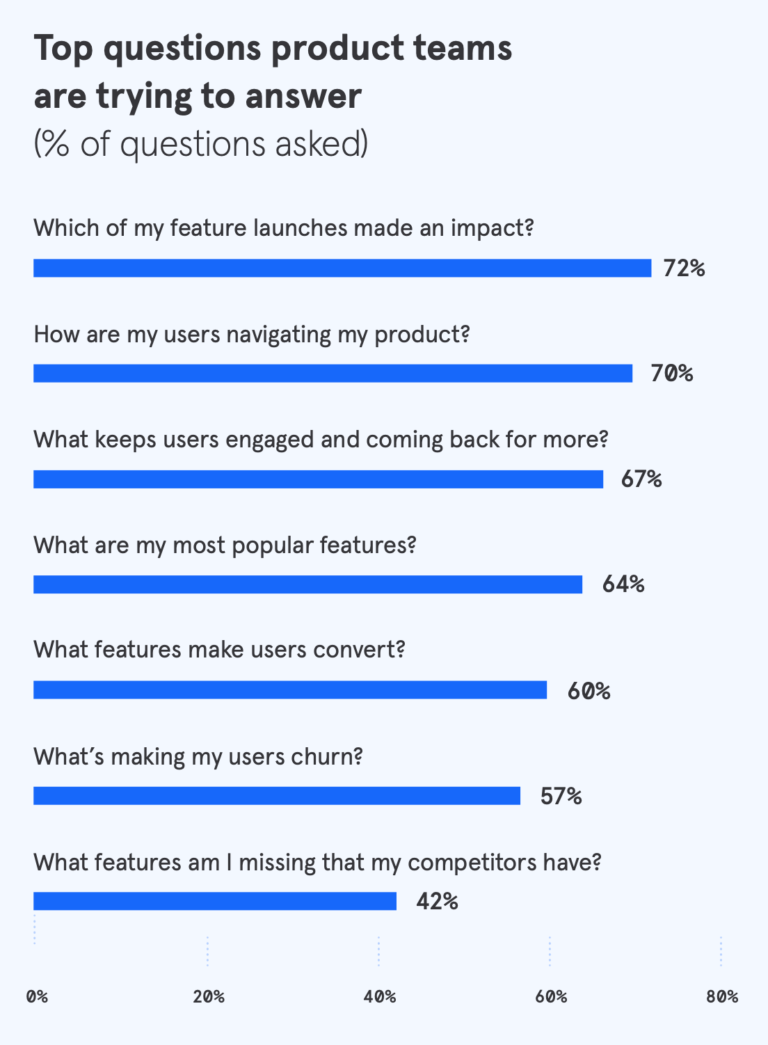
Which of my features made an impact?
Apps are often referred to as “products,” and the elements of the product that users interact with are often called, “features.” Top product teams utilize agile product development and aim to ship new features quickly. From there, they see if the features are contributing in positive ways to the user experience. If they do, they keep them, and if they don’t, they use data to understand how to improve them.
For example, Lemonade, a company that makes a mobile app for buying renters insurance, introduced a variety of new features to improve their quote-to-purchase rates. After each feature release, they measured its effectiveness, then improved upon it, ultimately boosting the rate of purchase by 250%.
How are my users navigating my product?
Within a product, or app, there are many paths users can take. The goal of the user is to get value out of the app, which could be defined as anything from entertainment to increased productivity to booking a flight for their dream vacation.
The aim of the product team building the app is to help users experience that value, with as little friction as possible. User flow analysis—also referred to as path analysis—is a common method of understanding the parts of an app that users gravitate toward, as well as those that drive users to leave the app.
What keeps users engaged and coming back for more?
Regardless of the type of app, consumers have many options to choose from, and only so much time and money to spend in any one place. Netflix, Hulu, and Disney Plus compete in the video streaming market, while Charles Schwab, Personal Capital, Betterment, and Robinhood compete for investors. Knowing the ways users engage within the app, as well as the behaviors that contribute most to user retention, is essential to success. App analytics tools, like Mixpanel, are purpose-built for this type of analysis.
Common metrics used to measure the success of applications
While knowing how users behave within an app is helpful, it’s not enough to make the app successful. The best apps are also viable business investments for the company making them and have a set of metrics designed to objectively measure their impact.
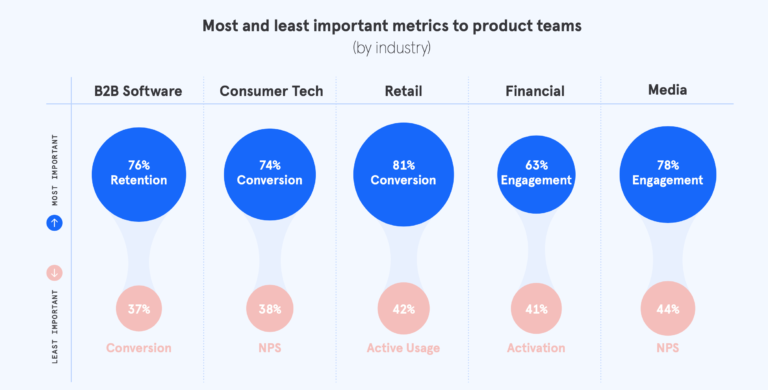
In a global survey, Mixpanel asked product and app owners to identify the metrics that matter to them. The most significant finding was that most teams use many metrics to get a holistic view of their success; five different metrics are used by over 50% of product teams.
- Retention (68% of teams measure)
- Engagement (67%)
- Conversion (59%)
- Revenue (55%)
- Active Usage (53%)
Having many metrics is a smart strategy, but each app also needs “one metric that matters most,” often referred to as a north star metric. When the data was broken down to identify the north star metric by industry, each was one of the top three metrics overall – retention, conversion, or engagement – but there was not a single dominant metric.
App analytics metrics examples
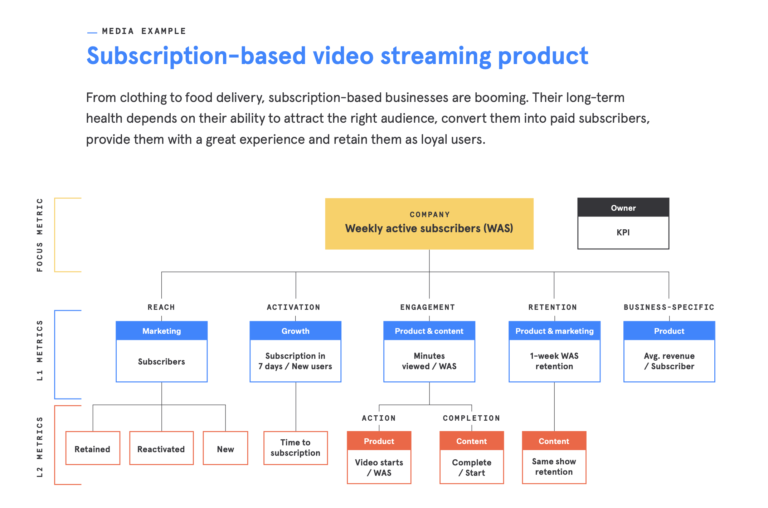
To define metrics for your app, you need to be specific and define exactly what conversion, engagement and retention mean in the context of the experience you’re providing. It can help to draw inspiration from other companies.
Conversion: Which users complete a specific series of actions?
- ZipRecruiter | Job search
- % of job seekers completing the application flow
- More detail on how ZipRecruiter moves its metric
- % of job seekers completing the application flow
- More detail on how ZipRecruiter moves its metric
- Lemonade | Home and renters insurance
- Quote-to-purchase rate
- More detail on how Lemonade moves its metric
- Quote-to-purchase rate
- More detail on how Lemonade moves its metric
- % of job seekers completing the application flow
- More detail on how ZipRecruiter moves its metric
- Quote-to-purchase rate
- More detail on how Lemonade moves its metric
- % of job seekers completing the application flow
- More detail on how ZipRecruiter moves its metric
- Quote-to-purchase rate
- More detail on how Lemonade moves its metric
Engagement: How engaged are your active users?
- Primephonic | Classical music streaming
- Media minutes consumed daily, weekly, and monthly
- More detail on how Primephonic moves its metric
- Media minutes consumed daily, weekly, and monthly
- More detail on how Primephonic moves its metric
- Mixpanel | Product analytics
- # users building custom reports 3 unique days in a week
- More detail on how Mixpanel moves its metric
- # users building custom reports 3 unique days in a week
- More detail on how Mixpanel moves its metric
- Media minutes consumed daily, weekly, and monthly
- More detail on how Primephonic moves its metric
- # users building custom reports 3 unique days in a week
- More detail on how Mixpanel moves its metric
- Media minutes consumed daily, weekly, and monthly
- More detail on how Primephonic moves its metric
- # users building custom reports 3 unique days in a week
- More detail on how Mixpanel moves its metric
Retention: How many of your active users come back?
- Ancestry | Genealogy and DNA analysis
- Recurring retention for their AncestryDNA mobile app (Do users come back each week / month?)
- More detail on how Ancestry moves its metric
- Recurring retention for their AncestryDNA mobile app (Do users come back each week / month?)
- More detail on how Ancestry moves its metric
- PatientPing | Patient care coordination
- First-time retention (Do users come back after first use?)
- More detail on how PatientPing moves its metric
- First-time retention (Do users come back after first use?)
- More detail on how PatientPing moves its metric
- Recurring retention for their AncestryDNA mobile app (Do users come back each week / month?)
- More detail on how Ancestry moves its metric
- First-time retention (Do users come back after first use?)
- More detail on how PatientPing moves its metric
- Recurring retention for their AncestryDNA mobile app (Do users come back each week / month?)
- More detail on how Ancestry moves its metric
- First-time retention (Do users come back after first use?)
- More detail on how PatientPing moves its metric
If you’re wondering which metrics are best for you, Mixpanel wrote a prescriptive guide to building a custom metrics framework for your product or app.
In summary: why app analytics?
To make an app great, it’s essential to understand how people use it and how it’s contributing to your business. That requires asking the right questions, measuring the right success metrics, and having the right software to dig into these metrics and behaviors to understand their drivers.
Web analytics software, like Google Analytics, specializes in web page analysis. The ideal tool for app analytics is capable of more in-depth user behavior analysis.
Having this type of app analytics software will enable you and your team to answer questions, like:
- What are my app’s most popular features?
- Who are my power users and inactive users?
- What are my upgrade rates and why are they up or down?
- What are the drivers of engagement and long-term retention?
- Which of my features are making an impact?
- And much more…