

What is your stickiness metrics really saying?

Stickiness is an extremely popular engagement metric. It’s used by product managers to make roadmap decisions, and it’s cherished by investors for its help in determining investment worthiness.
It’s also one of the most misleading metrics there is if you don’t know exactly how it works.
In this article, we’ll dive into concrete examples of how stickiness is calculated and compare the results so you can go beyond “good vs bad” numbers and make decisions that are truly meaningful for your product.
Stickiness and frequency of engagement
Google “stickiness metric” and you’ll find a never-ending stream of definitions, all stating how important it is, followed by a description of how it may be calculated. Most explanations are vague, and some even contradict one another.
All you need to know is that stickiness is one of several possible metrics for user engagement. In particular, stickiness attempts to capture the frequency with which your users are compelled to use your app. It’s not simply about whether your users return to your app at all or how many hours your users spend in the app; it’s specifically about how frequently your users open the app, engage with it, leave, and then come back for more on a different day.
DAU/MAU as the go-to formula
There are multiple ways to calculate an app’s stickiness, but the DAU/MAU ratio popularized by Facebook is far and beyond the most popular. That is, in order to calculate an app’s stickiness for a given month:
- Define what constitutes a meaningful engagement for your app.
- For each day of the month, calculate the total number of unique active users that engaged on each day (aka the
DAUfor the day). - Add the totals for each day and divide by the number of days in the month (aka average
DAU). - Calculate the total number of unique users who engaged at least once during the month (
MAU). - Divide average
DAUbyMAU.
For the purposes of this article, we are going to calculate stickiness for the month using the DAU/MAU ratio, but also stickiness for a given week using the corresponding DAU/WAU ratio. The latter ratio will help us get a more intuitive grasp of how the numbers lead to a given result in a variety of examples since data for a week is much easier to process than for a whole month.
Same stickiness, very different data
With all that said, the first insight to glean about stickiness is that wildly different sets of data can yield exactly the same stickiness result, and that has serious implications for how you ought to apply the stickiness ratio to your product with any real meaning.
Example A: 1 user, 1 day
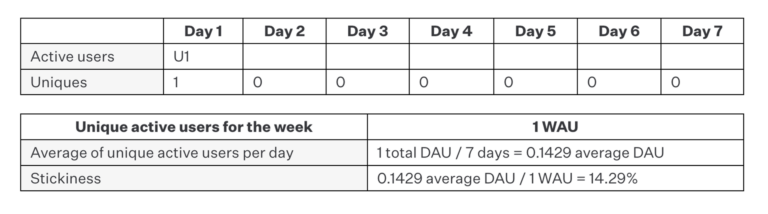
In this first case, for instance, we calculate stickiness for one week and notice that we have a single active user who engaged with our app just once. While we normally wouldn’t bother calculating stickiness for a single user, it’s important to see how this plays out with respect to future examples.
When applying the formula of average DAU / total WAU, we get a stickiness of 14.29%, which means that our users engaged with our app on 14.29% of the available days in the measurement period of one week. Since the data set is so small, we can check our work and see that our one user visited on just one day in seven days (1 / 7) which equals 14.29%.
Makes sense.
Example B: 1,000 users, 1 day
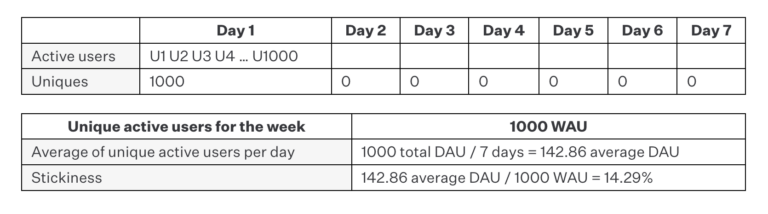
Now consider a case where we have 1,000 users rather than one. As it turns out, all 1,000 users engaged with the app on the first day of the week and not at all on the other days. But if we apply the same stickiness formula, we get the same result of 14.29%, which makes perfect sense since each user engaged with the app on only 1 in 7 of the measured days (i.e., 14.29% of the time).
As such, this example reveals two things. First, the total number of users has no impact on the stickiness result since it is always expressed as a percentage of days on which a proportion of engagements occurred. Second, it begins to demonstrate that stickiness on its own is always incomplete. In example A, the fact that one user engaged on one day doesn’t really provide much product or investment guidance at all. However, the fact that 1,000 users engaged on a single day in example B says we might be doing something right even if our app isn’t particularly sticky, so total users also needs to be considered at the very least when making high-level decisions.
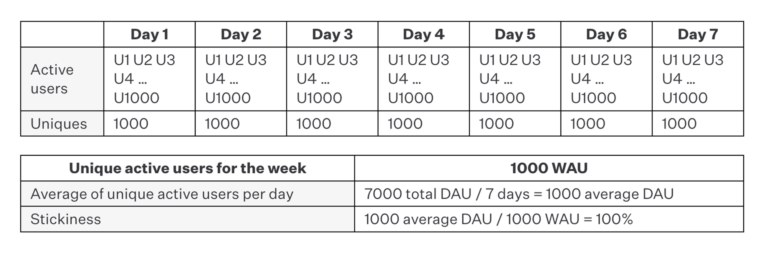
Example C: 7,000 users, 7 days
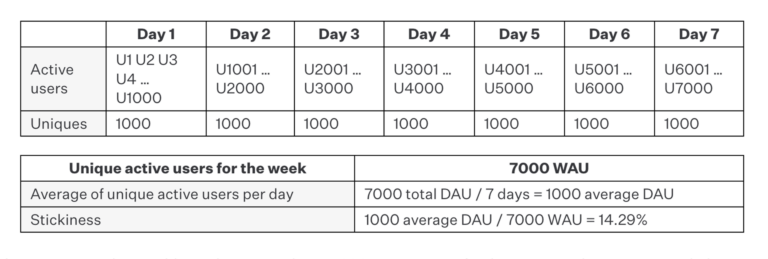
In this case, we make an additional point. We have 7,000 unique users for the entire week. However, each day sees its own set of 1,000 unique users, which, in turn, leads to exactly the same stickiness ratio we’ve seen thus far: 14.29%.
How can this be? Unlike the previous examples (where all users engaged on the same day), we have users engaging on 100% of the seven days. Doesn’t that imply a higher stickiness ratio?
No, it doesn’t. The key thing to notice is that while each day sees 1,000 unique visitors, there’s no overlap between the days. That is, each set of 1,000 is different from the next, which implies that each individual user has only engaged with the app once for the entire week. This is the same for both examples A and B, where each user engaged on only one day. The only difference is that our 7,000 unique users have engaged once on different days, rather than on the same day.
In the prior examples, we might conclude that something happened (e.g., a marketing or push notifications campaign) on the specific day that all the engagements occurred, thus implying the source of the engagements is less a reflection of the product’s inherent stickiness than an isolated event. However, in this case, even while stickiness is low, we can at least draw some insight into the fact that we can continue to acquire users on each day, which at least rules out the influence of a single event.
In any case, stickiness is about frequency of visits, and that remains the same across all examples thus far, even though the distribution of engagements is materially different.
“Good” stickiness is not always good
Now that we’ve established that the same stickiness can be reflected by radically different data, we can explore different ways in which a so-called “good” stickiness ratio can be similarly misleading, while also further demonstrating what stickiness inherently means.
Example D: 1 user, 7 days
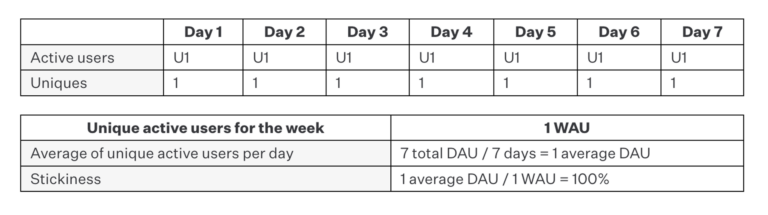
In this case, we’re back to having only one unique user, but that user returned every single day during the period measured, yielding a stickiness ratio of 100%. This is the best possible stickiness ratio, far exceeding any wildly successful commercial product on the market today. While that’s a “great number,” this example further shows why stickiness can’t be taken at face value and must be weighed with other metrics. That is, who cares about a great stickiness ratio if the number of users isn’t meaningful? The behavior of one user simply isn’t predictive of users acquired in larger numbers.
Example E: 1,000 users, 7 days
Alternatively, we have 1,000 unique users for the week, and every single one of them engaged with the app every single day of the measurement period, yielding a stickiness ratio of 100%. While this is highly unrealistic, it would at least be meaningful if we were to see this measurement in real life compared with Example D. Observing that 100% of 1,000 users engaged every single day means that something you’re doing is influencing user behavior at a meaningful scale, and it, therefore, may be worth pursuing the product further.
The problem with averages
A reality about stickiness that is often overlooked during the decision process is that it relies on averages. A given stickiness calculation may meaningfully reflect a desire to engage repeatedly in many data sets, but there’s a non-insignificant number of circumstances where the averages don’t tell a meaningful story.
For these examples, we’ll calculate stickiness over the course of a month (as it’s typically done in practice) to make our points more clear.
Example F: Unusually grouped usage
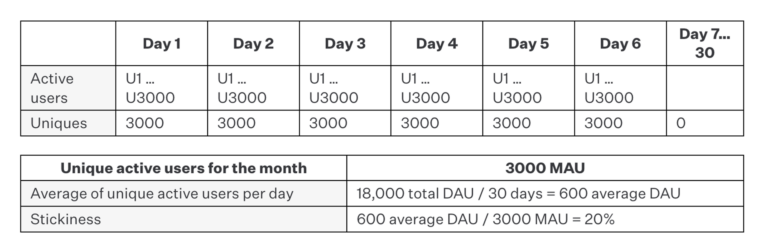
Here we have a month with 3,000 unique active users. On the first six days of the month, 100% of users engage at least once with the app. Then zero users engage for the rest of the month. The resulting stickiness is 20%, which is widely considered to be a strong stickiness value in the industry.
The problem, again, is that the data has implications that undermine the result. When we measure stickiness, we are generally trying to get a sense of a product’s inherent habit-forming properties such that users want to return repeatedly at an organic and sustainable pace. The fact that all users engaged on the same days singles out those days as potentially significant in themselves, with the fact that they happened on consecutive days further begging the question as to temporally-specific influences. As such, we can’t really make a generalization about an app’s inherent qualities distinct from the time period during which the engagements were measured.
While this scenario is unrealistic and extreme, there are many iterations of this scenario that do play out in real life, with the results significant but not always dramatic enough to be noticed.
Example G: Cohorting stickiness
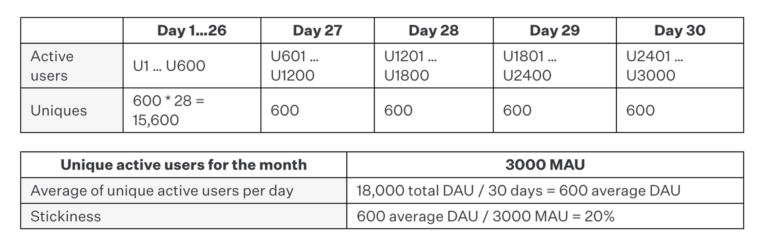
In this example, we have the opposite problem. We have the same stickiness ratio of 20%, but there is no user who has an individual stickiness of 20%.
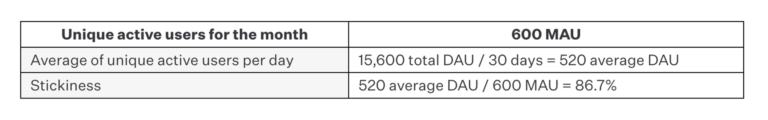
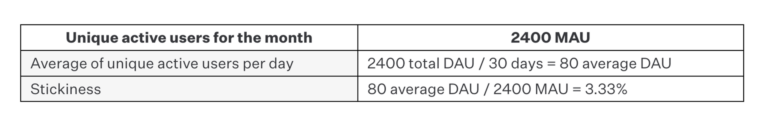
That is, if we consider users 1 through 600 as their own cohort (Cohort A), they have a much higher stickiness ratio of 86.7%. On the other hand, if we consider the remaining users their own cohort, they have a much lower stickiness of 3.33%. As such, it would be insane to ignore this nuance and consider them together. The most strategic product decision would perhaps be to figure out what’s going right with Cohort A and divert efforts into acquiring more of those users in lieu of Cohort B.
Cohort A
Cohort B
In the end: It’s hard to standardize any metric
So what does teasing out this super popular stickiness calculation through various examples prove? I think it shows one-size-fits-all metrics like it are often lacking the accompanying qualifications or nuance to be useful. If you’re trying to track product success or wow potential investors with a single stickiness rate that has something like Example F’s data behind it, you’re essentially clinging to a vanity engagement metric.
Now, does that mean DAU/MAU can’t make sense to provide actionable insights? Of course not. The key is to strive to dive deep and wide enough into your raw engagement data to get the fullest and clearest picture of stickiness you can. And when that’s not possible, using multiple metrics or adding qualifiers to your single stickiness metric of truth (i.e., how few users you’re measuring or what external factors are influencing those users at different times) can help you tell a fuller data story.