

The behaviors that drive customer love

Even in pre-COVID-19 times, it’s been held as dogma that loyal users are the core of any SaaS business. But beyond just being active, a product is made great by users who find enough value to form a habit around their usage of it.
For loyal users of Mixpanel, for instance, performing on-the-fly product analysis is about as routine as a morning coffee, workout, or PM standup.
Users like Brett:
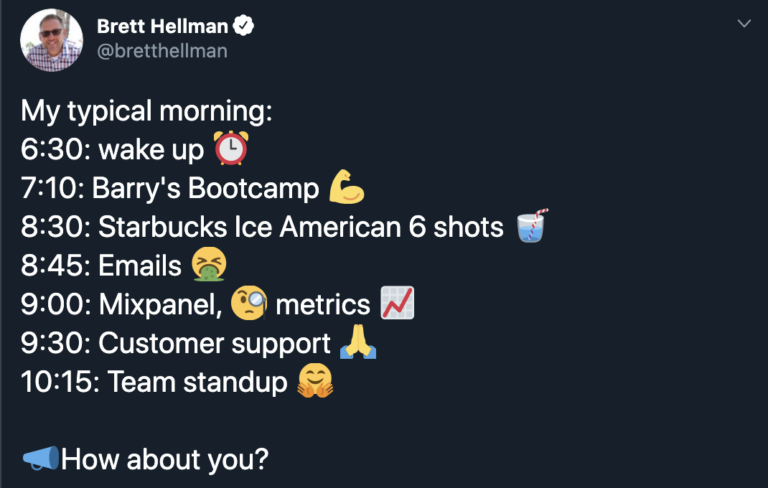
It’s no secret that Mixpanel has changed a lot in the last 12 months, and—based on customer feedback and our own user data—for the better. The story of Mixpanel is ultimately one of product-led growth, propelled and promoted by a passionate customer base. And as with all SaaS companies, the habits of our most dedicated users have evolved over time, and our understanding of those users along with it.
With all of this change, we knew it was time for us to build a new definition of user value in 2020—one that directly aligns with how we measure our own success as a business.
Our mission? Create more Bretts.
We started by asking, “What is it that Mixpanel offers that users can’t get elsewhere?” And further yet, “What makes them fall in love and want to keep coming back?”
After many whiteboard sessions, data dives within Mixpanel, and snacks both savory and sweet, we landed on a simple way to understand and measure user value that we call LUV. An acronym for “Learning User Verified”, LUV gets at the heart of what users set out to do when they login to Mixpanel.
More than just viewing a report or dashboard, users seek to understand how people are using their product with every query they build. They come to Mixpanel to learn.
Below, we’re sharing how we used Mixpanel(!) to build a deeper understanding of what drives customer love.
How we found LUV
From activation to habit
When we first set out to find LUV, we wanted to build a more concrete understanding of what it meant for a user to be deeply engaged, or learning.
In other words, to define the recurring “aha moment” in their journey from question to answer.
By focusing on the moment when a user first experiences what Mixpanel can do for them—which is to provide answers to their questions with trusted data—we could then pinpoint how that behavior is repeated for users who’ve stayed around for a long time.
We established a few parameters at the outset. Our new company focus metric ultimately needed to:
- Connect to a behavior that’s repeated on a regular basis (be focused on habit building)
- Translate to success for every user (be correlated to retention)
- Go hand-in-hand with user value (be deeper than surface-level activation metrics)
- Center on a common behavior that’s well understood (be easy to communicate)
- Mean everyone can get the answers they need in Mixpanel—not just power users (be representative of the greatest possible population of customers)
Much of our thinking was guided by Reforge’s teachings on retention and engagement, and in particular, their frameworks outlining how user engagement breeds habit formation.
As Reforge explains, engagement leads to long-term retention and sustainable growth. In addition to breadth—the percentage of users who are active in a given time period—a holistic understanding of your product also captures depth—how active they are within that time period, measured by engagement.
And deeply engaged users, we knew, would be the key to long-lasting LUV.
Using retention analysis in Mixpanel
Although one-to-one customer conversations and surveys are part of a well-rounded approach to understanding users, a product analytics tool lets you do this with more precision, minimal bias, and at scale. So, we started in—you guessed it—Mixpanel.
To better understand the core behaviors that drive retention, and at what frequency, we used the following approach:
- Dove into our Flows report to uncover the most common pathways that led to users finding success in Mixpanel (including events like “create account”, “add to dashboard”, and “share report”—we ended up with a list of more than 50!).
- Re-created those pathways in our Funnels report to identify the best performing iteration of them all.
- Created user cohorts from each step in the funnel, then compared them using our Retention report to determine which pathway had not only the best conversion rate, but also the best retention rate.
During this discovery period, we layered an internally developed framework onto our analysis that we call the “retention-adoption frontier,” a measure of our overall N-period retention rate.
The thinking goes that while some activities rank high on adoption (e.g. viewing a report), they correlate to lower retention. In contrast, activities that see lower initial adoption rates (e.g. editing an event definition) correlate to higher long-term retention for those who do that activity. Taken together, all of the behaviors that customers adopt are what determine Mixpanel’s overall retention.
Our goal was ultimately to find a behavior that scored high on both adoption and retention.
In the end, there was one category that more often led to users experiencing Mixpanel’s core value proposition with minimal friction:
For many, the act of segmentation, or applying “filter” and “break down by” in their queries, led to getting an answer in Mixpanel. And users who did this successfully came back to do it again and again.
But we knew that measuring retention on the wrong cadence could trick us into thinking our product had good retention when it really didn’t. So we also had to consider the optimal frequency at which people performed query segmentation.
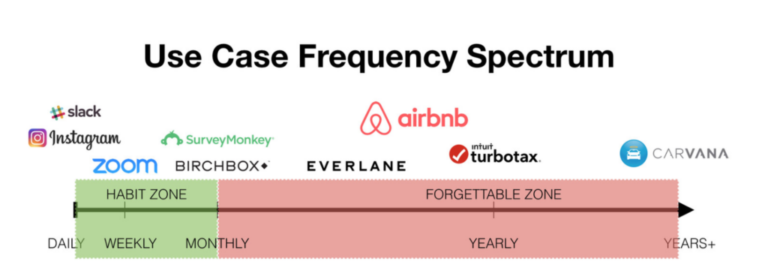
We hypothesized that a weekly “habit zone” made sense for a SaaS business like ours (as opposed to daily for a social media platform, or monthly for, say, a health tracker app).
Our analysis in Mixpanel showed that segmentation performed 5 out of 7 days per week correlated to higher retention. But segmentation at a cadence of once per week was more common. Additionally, though performing segmentation 10 days in every 30 was connected to high retention and was common among users, it was ruled out because it meant we’d need to wait four times as long to measure success. We wanted a metric that could be both easily understood and quick to act on.
So, where did we ultimately find LUV? (It wasn’t in a hopeless place).
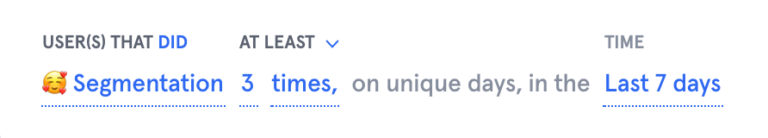
A “Learning User Verified” defines their own query in Mixpanel 3 out of 7 days each week.
And while there are certainly power users who perform more advanced query segmentation in Mixpanel at various frequencies, we wanted to orient our metric around regular, habit-forming activities that drive value for product teams, and ultimately contribute to their success.
LUV conquers all
Our road to LUV hasn’t been an easy one, and with many companies facing the headwinds of COVID-19, much of the work is just beginning. But we’ve never been more steadfast in our commitment to creating long-term value for our users.
Taking the time to align on a company metric that serves the long-term needs of users, and the business, requires energy and focus, but the returns can be seen in the renewed clarity and purpose felt across every function—from product and design, to marketing and sales. With LUV embedded in each feature release, it’s also helped our leadership team make the right product trade-offs without causing friction.
Because every single Mixpaneler is focused on influencing a metric directly tied to customer value.
From a product perspective, there are a couple of ways we’re already reducing time-to-value and helping users become learning users.
Demo experience
A product demo that lets prospective LUVs experience the value of Mixpanel firsthand is one of the most powerful tools in a product-led growth company’s toolkit.
That’s why our just-released demo experience allows would-be users to explore Mixpanel using sample data sets from a vertical of their choice.
Onboarding experience
Our quest for LUV deepened our understanding of what makes new signups stick, and what causes them to drop off. As a result, our onboarding experience will focus on giving users a straight-line path to activation by removing potential obstacles to value.
While revamped product tours and tooltips are on the roadmap, we recently launched a new ‘Intro to Mixpanel’ onboarding walkthrough available to all new customers.
At the end of the day, the future success of Mixpanel will be measured on our ability to help customers get self-serve answers with trusted data, and ultimately, to build great products.
In the name of LUV, we hope you’ll come along for the ride.
Tell us how we’re doing! Get help, ask questions, and share feedback in The Mixpanel Community.