What is Product Usage?
What is Product Usage Analytics?
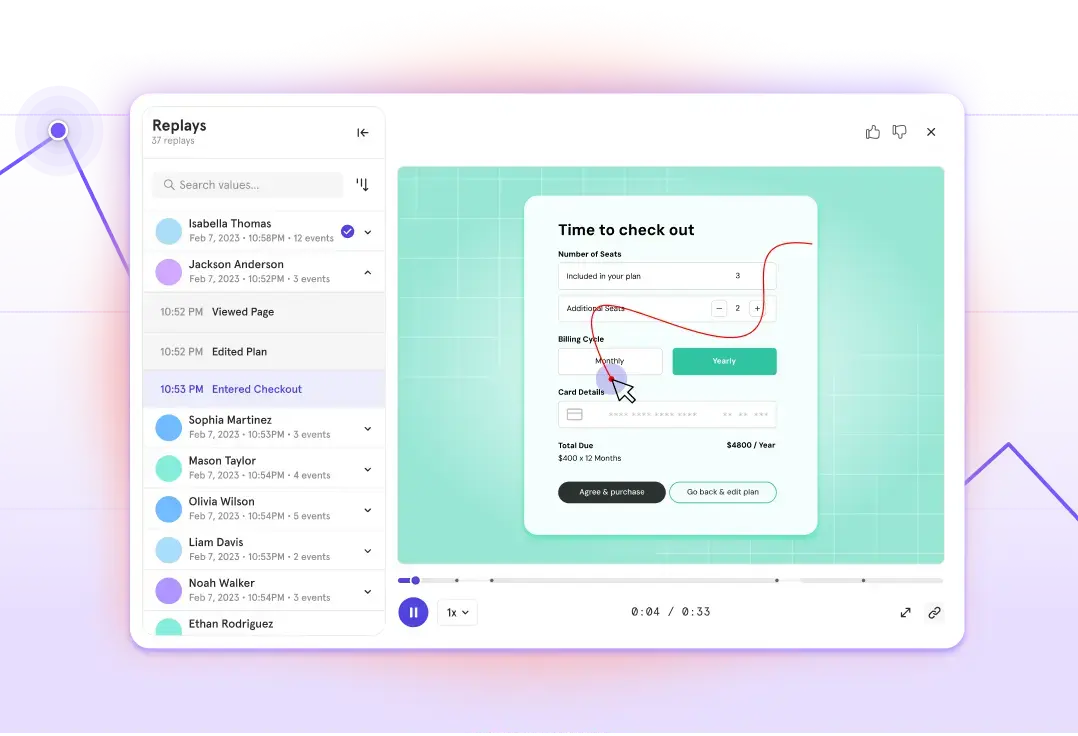
Product usage analytics is the analysis of data produced by users that interact with a product. It’s a quantitative measurement of how a product is used and its general performance rather than a subjective observation.
This type of analytics should be performed on a regular basis, particularly after a product goes through a redesign or new features are added.
Why is Product Usage Analytics Important?
Knowing exactly how customers are interacting with your product provides invaluable insight. These logs of data are more beneficial than beta testing, usability tests and customer interviews because it tracks how real customers use the product in a real world setting in real time.
Access to this type of data can help you:
- Evaluate product performance
- Locate and fix bugs
- Improve the product quality
- Improve user experience
- Increase conversions
- Retain more customers
- Craft messages
Products are made for customers, but customers don’t make the product. The closest a company can get to having customers on their product development team is analyzing product usage data.
How is Product Usage Tracked?
Product usage data is logged by software in a format that isn’t user-friendly or readable. These software usage logs require extraction, transformation and loading into a database before it can be analyzed.
Today, third party analytics platforms like Mixpanel are able to simplify the process of tracking product usage data. The Mixpanel platform:
- Collects the data from raw log files
- Stores product usage data
- Transforms the data so that it’s readable
- Automatically generates reports, charts and graphs to visualize the data
- Provides tools for deeper analysis of product usage data
Product usage data can be compiled, transformed and loaded using in-house procedures, but building the database and configurations require a significant amount of expertise and resources. For most companies, a third party platform with built-in reporting features is the most efficient and cost effect option for tracking product usage data.
What Are Product Usage Metrics?
Once you start digging into product usage data, what metrics should you examine? With product usage it’s easy to venture into information overload territory because there’s so much data available. Below are product usage metrics that are commonly tracked:
Usage Frequency – Usage frequency tells you how often customers are using your product. The goal is to have customers use your product on a regular basis, which indicates satisfaction and that it’s meeting customer needs.
Time Spent Using the Product – If customers only use your product for short periods it could be a sign that the user experience needs improvement. Customers should also be able to perform tasks in a reasonable amount of time.
Bug Reports – How many bug reports do users send in? A sizeable number of bug reports indicates that product quality could be lacking.
Customer Retention – Product quality is directly related to how well you hold on to customers.
Churn Rate – Metrics related to churn rate, the percentage of customers that stop subscribing to a product or service, are ideal for product usage analytics. Insight into how your product is used can reduce churn rate and increase the lifetime value of customers.
How Does Product Usage Influence Customer Satisfaction?
Decades ago, analytics experts began discussing how product usage influences customer satisfaction. Case studies have shown that product usage has a definite impact on satisfaction. Customer response can be further enhanced through product usage analytics that improve product development, performance, communication and engagement. All of these factors play a role in customer satisfaction.
How to Use Product Usage Data
Product usage data can be extremely actionable when it is parsed out and put into a format that is easy to understand. It can be used by product managers, account managers, sales managers, developers, marketers and user experience teams.
Product usage data is commonly used to:
Identify Trends
Visualizing the data in graphs and charts allows you to identify trends that can be used to improve your product, target a customer base or create more effective marketing campaigns.
Enhance the Experience for Struggling Customers
Paying customers that are having difficulty using your product are less likely to renew their subscription and purchase upsells. Customer retention is crucial for profitability in the SaaS and app industries. With product usage data you can figure out where customers have hang ups and make improvements. Once the improvements are made you can use it as an opportunity to reach out to customers and let them know the product was redesigned to better meet their needs.
Pinpoint Customer Characteristics
User behavior is part of product usage data. Not only can you tell how customers use the product, you can also get a gauge of their knowledge level, the type of operating system they’re most likely to use, where they live and more.
Convert More Trial Users
Trial users are giving a product a test run. If they come across problems or hang ups using the product they are more likely to churn during the trial period. Product usage data can tell you what issues trial users are running into so they can be fixed.
Upsell Free Subscriptions
If you have free and paid versions of a product usage data can help you convert more free users into paying customers. The data can tell you which paid features appeal most to the free users and which paid features they tried to access.
Gauge Feature Popularity
Knowing which features are the most and least used can inform future product development.
Improve Flow and Efficiency
Product usage data gives you an understanding of how users move from task to task. The information can be used to improve workflows and efficiency.
Create Product Training Tools
The data you collect can be used to create product training tools that help future users and reduce customer service requests.


