

The behavioral analytics guide

Behavioral analytics is the process of using behavioral data—or data generated by, or in response to, a user’s engagement with a business, such as page views, email sign-ups, or other important user actions—to segment users according to their behavior. Businesses can use that information to analyze things like engagement, conversion, and retention.
Ask the top organizations around the world—in any industry—how they build successful products, and you’ll hear some variation of this answer: “We followed the data.”
When we study user behavior, we gather data on what people do—and what they don’t do—so we can build products that people will value. After all, you wouldn’t build a product that no one would use, would you? Nor would you invest time, money, and energy in a feature set that has no observable demand.
Behavioral analytics is what helps you understand what your users and customers are doing and why, so that you can build better products.
What is behavioral analytics?
Behavioral analytics is the process of using behavioral data—or data generated by, or in response to, a user’s engagement with a business, such as page views, email sign-ups, or other important user actions—to construct behavioral cohorts and analyze things like engagement, conversion, and retention.
When behavioral analytics is applied to digital product management (often called product analytics) it can take the guesswork out of development and mitigate the risk of every bet you make. Teams use behavioral analytics to determine what users like and don’t like and, by inference, what adjustments will make the product more valuable. Behavioral analytics is also the key to personalization, so that products can deliver the right experience to the right users at the right time.
In short, behavioral analytics plays a crucial role in developing best-in-breed products.
Applications of behavioral analytics
Behavioral analytics is useful across a wide range of industries and use cases. It can help all kinds of companies understand their customers better and create experiences tailored to them.
Ecommerce
A classic example of using behavioral analytics in ecommerce is targeted advertising.
Let’s say a potential customer visits a website and views a product, but doesn’t complete the purchase. Marketing teams use that data to automatically create targeted ad campaigns based on the customer's behavior, showing them products they’ve visited. This approach is more personalized and more likely to be successful than a more generic campaign showing a different, unfamiliar product.
Finance
Financial institutions and fintech companies can also use behavioral analytics for personalized recommendations and targeted ad campaigns. In addition, financial companies monitor anomalous user behavior to help them spot and prevent fraud. Have you ever had to enter extra verification before signing into your banking app from a new device, for example? That’s because the banking app detected unusual user behavior and wants to make sure you’re an authorized user before granting access.
Healthcare
Healthcare companies can use behavioral analytics to improve their patient experience. For example, healthcare companies can use reports like Funnels and Group Analytics to help speed up patient wait times or analyze clinic-level data to improve efficiency.
Watch our video to learn more about user behavior analytics for healthcare.
Product development
Behavioral analytics and understanding your users are the key to successful product development. PMs use behavioral analytics to determine which features to prioritize and which user cohorts drive the most value.
Let’s say you want to nudge more users to convert from unpaid subscribers to paid ones. You segment your users to compare both categories, and you notice that paid users are more likely to have shared a specific behavior—completing onboarding, for example. This leads you to hypothesize that users who complete onboarding get more value from your product, and are therefore more likely to be willing to pay for it. You can test this hypothesis by pushing more users to complete onboarding and see how that affects conversion rates.
Why is behavioral analytics different from other types of business analytics?
Unlike other types of business analytics, behavioral analytics combines two technologies: User segmentation and behavioral or event tracking.
While some analytics vendors offer only one or the other—user (object) data or behavioral (event) data—behavioral analytics ties users to the events they trigger, thus producing a map of their actions as a flow or customer journey.
Viewed either alone or in aggregate, user journeys tell stories that teams can use to tweak and improve their product development, marketing, and launch strategies.
Data sources and examples in behavioral analytics
Behavioral analytics combines data from different sources to map how users interact with your product. A complete behavioral analytics tool will combine and analyze website, product, mobile, CRM, and customer support data.
Combining data from multiple sources can be tricky without the right platform, and anyone combining data manually should be aware of possible duplicates or errors. Solutions like Mixpanel offer Warehouse Connectors, which sync and mirror data from your data warehouse so that anyone on the team can perform data analysis without dirtying the data.
By combining all of this behavioral data into a single platform, PMs can see how different actions across the company impact each other, and answer more complex questions, such as:
- Which acquisition channels had the highest ROAS?
- Did shipping this feature decrease (or increase) support tickets?
- Which marketing campaigns brought in users who continue using the product after a month?
- What percentage of our Enterprise revenue uses the features we shipped last year?
- Which account demographics have the best retention?
These kinds of complex insights are only accessible when you have a full view of user behavior.
The importance of user properties and event properties
Behavioral data can, and should, always be tied back to a single end-user, but good behavioral analytics typically involves separating “user properties” from “event properties”. Both are very important to analyze because they tell you who your users are and what they’re doing.
User properties are anything around user traits that reflect the state of the user and apply across all their events, including:
- Unique vs non-unique
- Active vs inactive
- New or not new
There are also several custom properties you can analyze, depending on the type of app or product you have. In a gaming app, for example, your custom user properties may include an amount of in-game currency and current game level.
Event properties involve any action a user takes in your product, which could be anything from making a payment to finishing a level to clicking a button. Event properties show you how your users are engaging with your app and will, of course, vary depending on the type of app you have and the specific information you think is required for understanding a particular event.
How can you benefit from behavioral analytics?
Whether you sell socks, streaming video, or a B2B SaaS product—if you want to grow, you need to do (at least) two things really well:
If a company wants to personalize its service to users—thus increasing the likelihood of acquisition and retention—it needs users’ behavior data.
For example, a streaming movie platform can’t know that a user loves horror films simply based on demographic information like their age, gender, or nationality. If they try to recommend horror films to everyone who fits a certain demographic, they’ll end up alienating a large percentage of their users. But if they look at behavioral data and only recommend horror movies to users who have watched horror movies in the past, they’re much more likely to find an interested audience. The key to that kind of targeting is seeing, analyzing, and understanding the signals a user sends with their behavior.
Behavioral analytics provides user-level data, so teams can answer questions like:
- What do users click within the product?
- Where do users get stuck?
- How do users react to feature changes?
- How long do users take from first click to conversion?
- How do users react to marketing messages?
- Which ads are the most effective?
- How can we nudge users to be more successful in what they’re trying to accomplish?
Conducting behavioral analysis is more complicated than simply running reports in an analytics tool. Teams must first identify what they want to achieve and write down the paths they expect users to take. Only with preset expectations can teams identify whether users are deviating from the ideal path and then redirect them.
Here’s an example of what that can look like:
The tech-driven insurance provider Lemonade adjusted its user paths to increase revenue. The goal was to convert more website and app visitors into paying customers. With Mixpanel analytics, they noticed a “staggering drop-off” in user flow right before the point of purchase. By analyzing the page where the drop-off occurred, the team realized it was due to a technical error and a weak call-to-action (CTA). They fixed the bug and reworded the CTA, which led to a 50 percent increase in the number of users who purchased additional coverage.
Steps for successful behavioral analysis
Embedding behavioral analytics into your organization’s culture can seem daunting—it involves a lot of decisions (big and small), followed by many tweaks and optimizations. As with most things, a “one-size-fits-all” approach isn’t going to work.
Some of the work involved is technical (wrangling data, implementing a tracker), while other tasks are strategic (goal setting, building a tracking plan), and still others are analytical (building and interpreting reports). There’s plenty of overlap, and achieving success requires tight collaboration between teams and departments.
Whether you’re starting from zero or already have a fully-fledged behavioral analytics stack in place, here are the high-level steps for kicking off any behavioral analytics project:
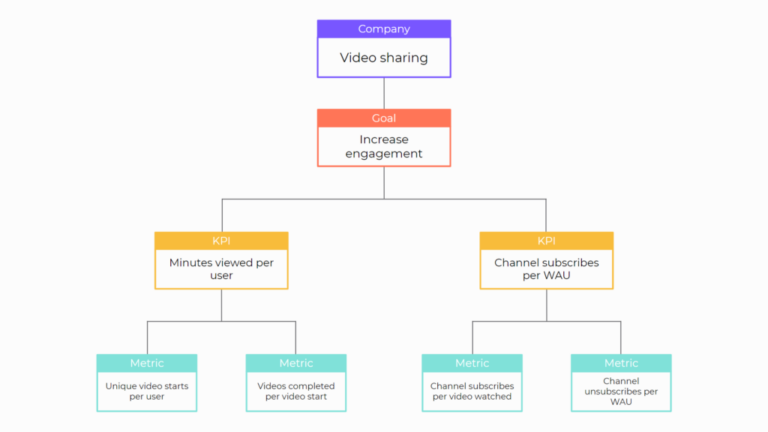
1. Select goals, KPIs, and metrics
To determine whether users are reaching the right goals (e.g., purchase or conversion), select the KPIs and metrics that indicate progress toward those goals.
Examples:
- A fitness app that makes money through monthly subscriptions tracks paid subscriber growth.
- An enterprise resource planning (ERP) software that relies on annual contracts tracks users who complete the onboarding sequence.
Note that behavioral analytics goals might be a bit different than you’re used to; we tend to conflate goals and results, and it’s much better to start from a goal centered on measurement rather than a goal centered on a particular result.
For example, “Increase sign-up conversion from 5% to 10%” is a wonderful goal in general—but it’s not an analytics goal. It’s a result.
Why? Because measuring something is not the same as changing it. The macro goal of any behavioral analytics project is to accurately capture behaviors, so we can analyze those behaviors and then make informed decisions about what we may change to make an impact.
A revised version of this goal might be: “Track all user journeys from Landing to Sign Up and find the best/worst conversion paths.” The revised version is a better goal because it focuses on measurement rather than a result.
2. Map out the critical paths
Critical paths are the series of events that need to occur or actions your users need to take for your product to be successful.
To determine your critical paths, ask, “What are the most common paths for users to reach their goals based on this service or app’s design?” If the product has already been launched, you can use actual user data to answer this question. If the product is pre-launch, use wireframes of the suspected or intended flow.
Critical path examples:
- An ecommerce website tracks a user from their first page visit to adding an item to their shopping cart to checkout because that flow leads to purchases.
- A streaming music app can track users as they move from its homepage to playing a song.
3. Create a tracking plan
Based on the user flow, decide which events you need to track. Tracking everything is a mistake—too much data clutters the analytics and makes useful information harder to find.
Some events contain multiple properties. For example, the event for playing a song within a music app could contain properties for the song title, genre, and artist.
To keep events and properties organized, companies typically create a tracking plan. This directory of all events serves as a map for implementing the analytics tool (see Step 5, below). A tracking plan should be revised and updated as the product, team, and goals change.
(To reduce the burden of trying to share and control access to the tracking plan, Mixpanel’s Lexicon stores the event name taxonomy for all to see.)
Involve all teams—analytics, product, marketing, and engineering—in drafting the tracking plan. They’ll all need to understand how the users and events are named and organized if they’re going to run reports and understand the results.
Of course, getting started with your analytics is often more important than fleshing out a robust tracking plan on day one. Opting for an auto-tracking solution at first is a great fit for many teams and organizations. Just make sure you're you're using a flexible option like Mixpanel Autocapture that allows precision tracking to be added on as you grow your analytics and better understand what's most important to track.
4. Use unique identifiers to understand behavior across platforms
Most digital products today exist across multiple platforms, which makes it difficult to track unique users and understand their behavior across these platforms. One user can appear to be multiple people unless assigned a unique identifier—either an email or a string of characters—that persists across platforms and devices and connects the touchpoints along their journey.
Teams should ensure their behavioral analytics platform vendor provides a unique identifier that won’t change over time so that they can track and understand their behavior across platforms.
5. Implement analytics and begin event tracking
Once the tracking plan is complete, you can deploy behavioral data analytics software and use its SDK or API to integrate it with your products. Assign a unique identifier for users and set up user and event properties as outlined in the tracking plan.
Sometimes you’ll discover additional events you want to track during implementation. This isn’t an issue as long as you update both the tracking plan and the analytics service.
Before the tracking system goes live, use test devices to verify that the event and user tracking is firing properly. Mixpanel’s schemas API and data audit features can help streamline this process.
When all your tests pass, you’re ready to start collecting real data and analyzing users.
Behavioral data and product management
Behavioral data is primarily used for product management. The ability to apply the results of behavioral analytics—using data to build better products while mitigating the risk of trying something new—is the return on your investment.
To apply the results of behavioral analytics, start with a hypothesis, use several different metrics to validate it, and then (through deduction and exploration) construct a KPI based on what you’ve learned. Only then are you ready to experiment with new features, test them on key cohorts of customers, and finally declare (with confidence) that you are building a better product.
This process is designed to be repeated. And as you repeat this cycle, you successfully iterate on your product’s development with a statistically-driven guarantee that the investments you’ve made are the right ones.
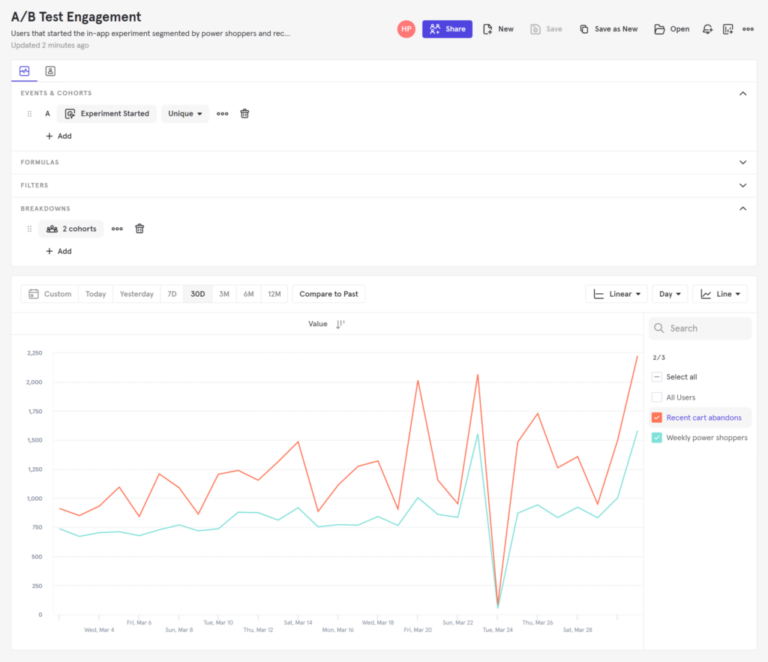
Segmentation
Most teams use segmentation to join users' characteristics and behaviors. An e-commerce app, for example, could create a segment for recent users who abandoned items in a shopping cart, or filter for power shoppers who access the app multiple times a week.
Segmentation helps teams build more complete customer profiles and create cohorts (defined segments of users based on common important characteristics or experiences). Armed with this information, they can adjust their product and marketing to better address the specific needs of each segment or of the business.
Watch our video to learn more about behavioral segmentation.
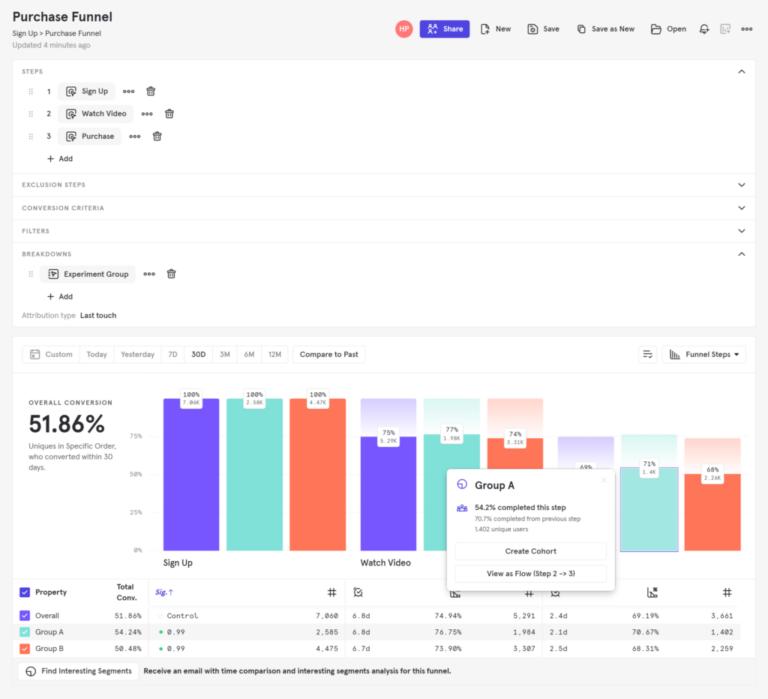
Funnels
To track users’ progress toward outcomes such as purchases or signups, many teams use funnel reports. Funnels display a series of stages in a user journey, as well as how many users progress from one stage to the next—for example, from download to signup and purchase. If one stage has a low conversion rate, it’s a signal that that stage needs attention.
Funnel data lets teams A/B test different buttons, messages, and images to see if small changes improve conversions. Funnel data can also be used to personalize parts of an app or website, say, to greet returning users, or present prospects with content relevant to their industry.
Watch our video on Mixpanel Funnels to learn more.
Teams can also use funnel data to deduce which behaviors are correlated with high retention. Your retention rate shows you an average across all users. By digging into behavioral and demographic trends beneath the metric, or by looking at specific cohorts, you can identify which users are likely to become loyal customers.
A media site, for instance, could look at the cohort of users that continue to return to the site eight weeks after signup to see if they share certain behaviors, such as a propensity to leave comments.
With a clear view of what’s happening within the product, teams can run experiments and make alterations to improve the product and help users find more value.
This is what “following the data” really looks like.
How to choose the right behavioral analytics provider
The best behavioral data analytics solutions are versatile, compatible with many systems, and offer quick results. They let teams integrate their full range of digital products, from desktop and mobile applications to internal services. They have friendly, intuitive interfaces that allow teams to quickly find answers, and they provide a breadth of functionality, including some that teams don’t yet need, but may in the future.
Swapping out a behavioral analysis platform can be a costly and time-consuming endeavor. Teams can save themselves time and money by doing their research and investing in a platform that offers them room to grow.
Look for user behavior analytics tools with:
- Ability to automatically capture user and event data points
- Ability to access data in real-time and query it in a variety of ways
- Pre-built reports such as funnels, cohorts, and retention
- Guardrails, automated notifications, and recommendations
- A data visualization component
Take the next step
Maybe you’ve been hearing things like “we don’t have the data” or “we don’t have the resources.” If you read between the lines, what you’re really hearing is: “Behavioral analytics is not a priority.”
This is a very risky attitude; if you don’t have the data, you can’t follow it, and therefore every decision your company makes basically amounts to crossing your fingers and hoping it works.
The best way to make behavioral analytics a priority is to start talking about it. If it helps, our customers have lots to say. And if you have questions, don’t hesitate to get in touch with an expert.