
5 tips for bringing your product to market faster

At Mixpanel, we relentlessly monitor customer feedback and take customer requests very seriously. So in the middle of last year, when we started seeing requests bubble up for a new report that would help customers visualize the many pathways their users take to a given destination, we took notice.
We received questions like, “what events do users complete before signing up?” and “where do users go instead of converting at the end of a funnel?” In Mixpanel, we were also able to see that users were building long funnels and creating cohorts based on drop-off to try to explore the other places their users were going.
These behaviors and requests turned into the Flows report at Mixpanel, but we weren’t the only ones that noticed this dire customer need. We knew that other analytics providers already offered similar reports. To deliver a superior user experience under such high stakes, we had to balance time to market with product completeness. We wanted our customers to be excited when interacting with the tool for the first time, while minimizing the additional time they would need to wait for it.
This led us to ask ourselves: how do we build faster to meet the needs of our customers while beating our competitors to market? Or more simply, how do we increase the rate of innovation? Without the ability to make the day longer, we turned inward to analytics to help us decide where to focus our efforts.
How to bring your product to market faster
1. Prioritize rigorously with analytics
To stay relentlessly focused on our customers, we conducted customer research to uncover the core use cases driving the need for the Flows report, stack ranking along the way based on the size of the opportunity and how many resources they would take to address. We consciously decided to start from a blank slate when it came to the process, knowing that updating Jira tickets, extra meetings and management reports can detract from actually building the product and getting closer to accomplishing goals. To expedite our work, we went back to basics in specs and adopted a simple prioritization framework that helped us define customer value clearly without spending too much time in planning.
To shorten time to market, we focused on building the bare-bones minimal viable product (MVP) which would address the customer’s core needs. In this instance, that was the ability to visualize the flow of events from one customizable point to another.
2. Create a nimble, speedy team
To get to our MVP as soon as possible, we created a nimble team of six members consisting of both experienced staff and hungry newcomers. They provided the perfect formula to ensure we had all the right skills, expertise and passion needed to succeed.
Besides a foundation of support on the go-to-market side, our team structure was limited to a senior and junior designer, an accomplished and up-in-coming front-end engineer, best-in-class back-end engineer, and a Product Manager.
Keeping the team small minimized the amount of time and effort it took parties to stay up-to-date, connected and informed. As a result, everyone was able to work on their respective tasks, energized by the progress being made by their teammates.
3. Put a stake in the ground
There were numerous directions we could take this feature, and many competing visions attracting attention. To combat this, we established the core pillars that we cared about more than anything else to help guide our development. We decided to make a strong bet in the below core areas, where we saw the largest gaps in the market:
- Delightfully easy-to-use interface: our core goal was to remove any complexity and make the charts legible, so whenever we had to make a tough choice, we always focused on usability before adding anything that could clutter up the screen.
- Unlimited exploration options: we never wanted to limit users’ exploration into their own data. We prioritized putting the user in the driver’s seat wherever possible, making sure they had access to whatever depth of analysis they needed.
- Making data beautiful: just because a report is complex, doesn’t mean it can’t be visually pleasing. We wanted to ensure that in spite of the complexity of the data in our Flows chart, it remained easy to read and navigate so users were not afraid of going more in-depth. The way we saw it, Product Managers, Marketers and Analysts are going to be looking at these charts for hours, so why not make them nice to look at?
Tips for a winning go-to-market strategy
4. Provide customers with value right out the gate
We not only based our Flows report on customer insights, we also perfected it using feedback from customers on our MVP in closed and open beta stages. More customer feedback is better for product development, so we wanted to get our product in the hands of our customers as soon as we possibly could.
By launching our MVP early, we were able to add focus to our efforts, allocating resources to what really mattered most when it came to releasing our product into the world. Here’s a timeline of how we launched beta and GA for our Flows report, all within 6 months:
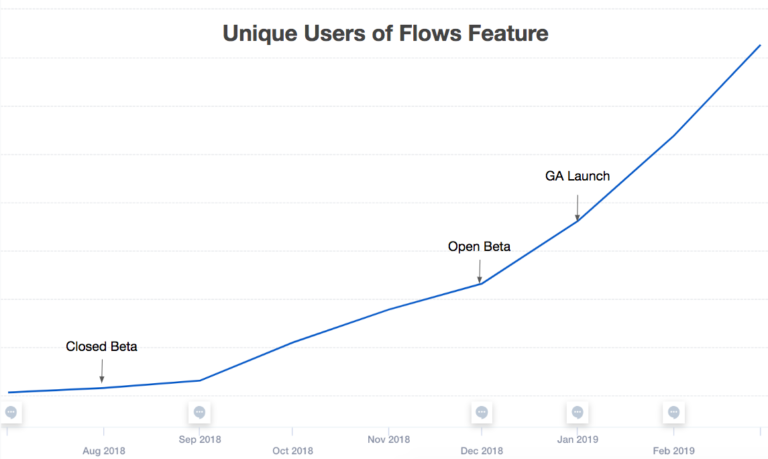
- Pre-MVP (Jul ‘18): In the first phase we conducted in-depth customer interviews to get a crystal-clear understanding of core features users cared about.
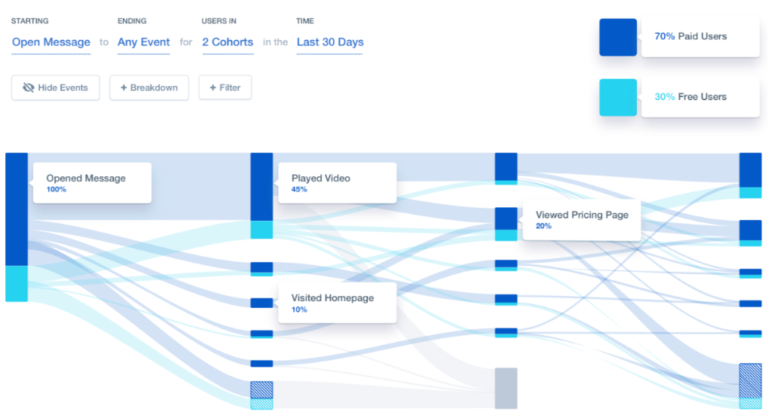
- MVP (Aug, ‘18): We delivered the first iteration of the Sankey chart and top paths, building an MVP that was ready to share with the first round of customers via a closed beta.
- Open Beta (Dec ‘18): We expanded the reach of our beta to our top 300+ customers across the world. We asked participants to provide feedback via email and phone calls and ended up learning about the experience of using Flows from customers in Israel, France, Singapore, and the United States.
- General Availability (Jan ‘19) Just like that, we were GA! We used Mixpanel to track adoption of Flows and validate that users were discovering and engaging at the expected rate.
5. Go beyond the status quo and launch state-of-the-art features
So all this to say, focused execution driven by customer feedback is the best way to hit your goals faster, and then some. We were not only able to meet our goals ahead of schedule, but we also built the best Flows product on the market. Below are a few of the tools that are only available on our Flows feature to date:
Compare by cohorts enables customers to:
- Compare mobile and desktop users, and learn where each gets stuck.
- Understand what events customers who upgraded completed, compared to those who didn’t, to help guide more customers towards desired behaviors.
Unlimited steps enables customers to:
- Look for ‘aha’ and habit moments with more steps and cardinality controls. We believe paths visualization products should be exploratory in nature. If your customer did 15 events in a session, there is no reason why we should limit you to only the first five steps.
The Flows report has become Mixpanel’s top-rated enterprise specific report and is a leading reason why companies on lower-tier plans upgrade.
But one of the best things to come out of this launch wasn’t the product, it was the process. Through staying rigorously focused on customer feedback, we got to take our customers along on the journey to shipping Flows with us. Now, our customers know we listen. They also saw the speed at which were able to iterate and ship the product, giving them confidence in our ability to deliver on our vision and roadmap.
Interested in seeing a demo of our new Flows feature? Flows is now available to all Mixpanel customers. Contact us today to learn how Flows can help you bring your product to market faster, and better.