

More data, more problems? Here’s how Data Views in Mixpanel helps.

With our recent release of Warehouse Connectors, we’ve made it easier than ever to automatically pull data from your source-of-truth warehouse into Mixpanel to analyze and glean insights from. This allows teams like product, marketing, engineering, design, and others to all effortlessly visualize their users’ behavior and analyze results from releases, campaigns, and other initiatives. And that means more teams throughout the org can use Mixpanel to make better decisions about building their next solutions.
But with all this extra data coming into Mixpanel, won’t it be a little too easy to get lost in the chaos when team/function/location-specific events and properties all live in the same place? A marketing team might not want the plethora of events being tracked on the product team’s instance to interfere with their campaign analysis. And a sales team might get lost looking for their customers’ recent activity when sorting through the design team’s events and properties.
Don’t worry, we’ve thought of this too.
Data Views: A cornerstone of data governance across teams and projects
As a tenured customer account manager at Mixpanel, two of my personal favorite and most underrated Mixpanel feature sets I get excited to show off are Data Views and Data Classification, both of which make it easy to painlessly practice data governance—one of our foundational principles—across your org, regions, or apps/platforms. I am often surprised by the number of Mixpanel customers who are not aware of Data Views and Data Classification, so I’m looking to solve that with this post.
But how do they work? Well, I’m very glad you asked.
Now that you’ve set up Warehouse Connectors to pull cross-functional data across teams from your warehouse into Mixpanel, you can create a Data View (a mini Mixpanel project within a Mixpanel project) that will only display events and properties you’d like that specific Data View to contain—i.e., a marketing Data View containing only campaign/ad data, a sales Data View containing only customer data, a customer success Data View containing only North American customer data, etc.
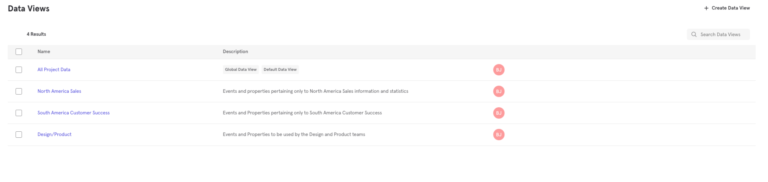
Now your teams can have quick access to the data that pertains to them and not the many other events and properties specifically pertaining to other teams. Better yet, this can be used for far more than cross-functional purposes: separate customer data from internal user data, regions or geo-based teams, verified vs. unverified data, specific platform/app version—the sky’s the limit!
The best part? It only takes a few clicks:
To bring this home a bit, here are a couple of use-case examples to give you a couple of starting points:
A product Data View

Hamilton is a product manager at Shoppy. He wants to check in on how the recently released iOS app has resonated with their product’s user base, but when looking for the iOS app’s specific behavioral data, he gets lost sorting through all of the marketing team’s events for their recent campaigns for an entirely different product. While this other data is still valuable and could come into use in the future, he wants to visualize data that only pertains to the iOS app release without having to create a separate Mixpanel project. Now he can create a Data View for events and properties that pertain to the newly released iOS app while still having the ability to pull in other data in the future from across the organization. Much, much simpler!
A customer health Data View

Divya is a customer success manager for BioShine in India. She wants her Mixpanel instance to only contain customers in India to analyze how users in her region interact with their product to find gaps, blockers, power users, etc. However, when trying to see if the recent marketing push in India has affected her weekly active user count across her book of business, it becomes difficult to discern between the North American marketing campaigns and marketing campaigns specific to her region. The solution: Divya created a Data View that only includes her region’s marketing and user information to more easily build reports, share insights, and better inform her specific customer base.
Now that we’ve set up these Data Views, how do I continually make sure only the right events/properties are added, edited, and dropped to help reduce duplicate events/properties, confusing naming conventions, incorrect teams adding data, etc.?
Wow, the great questions keep on coming!
Data Classification and Event Approval
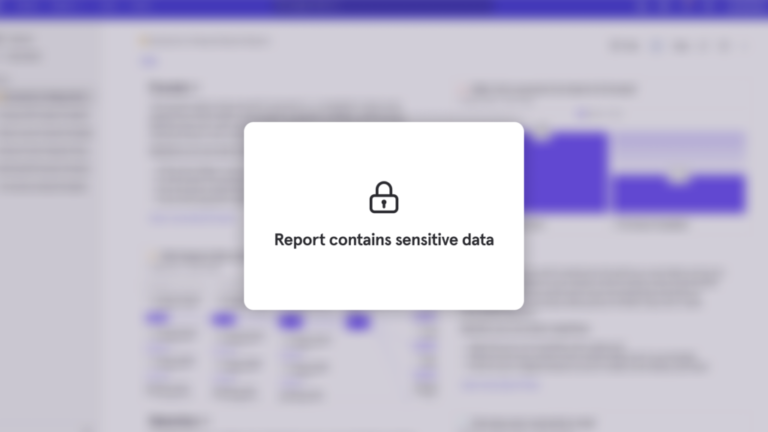
There are times when sharing data across teams involves certain pieces of data that might be sensitive or at least shouldn’t be seen or used by other teams.
Our Data Classification feature makes it super easy to mark certain properties as “classified” so that only certain users can access those properties and, in turn, those reports. The use cases here stretch beyond certain categories such as protected health information (PHI) for health-related companies/purposes or de-identification of certain pieces of data for sharing insights with third parties.
Time for another example!
Let’s say you are the CFO of a large organization and you’ve input a good deal of internal, confidential financial data into your Mixpanel project. You want to collaboratively analyze this data with your finance team but restrict access to others in your organization. To accomplish this, you create a Board in Mixpanel to monitor certain financial metrics and benchmarks, but you want to make sure only your finance team can view it. With Data Classification, you can limit access to the Board by classifying certain properties as “classified,” wherein the entire Board becomes only visible to those whom you have given “Can View” access.
Lastly, we know that Data Governance across teams, geographical regions, etc. is paramount to ensure that no duplicate or improper events are being input into Mixpanel. This is where our Event Approval feature comes into the picture, which makes cleaning up data access more effortless than ever. Put simply, the Event Approval feature grants account owners and admins the ability to “approve” which events are being sent into your Mixpanel instance, making it simple to reject an improperly set or duplicate event being created in Mixpanel that would clog up your teams with misleading, duplicate, or unhelpful events. Event Approval allows for a universally smooth and more seamless data governance experience.
Discernible data for all
We recognize the need and desire for fluid and seamless data democratization. That’s why Mixpanel is making it easier than ever for multiple teams, geographical regions, and project owners to not only have their data in Mixpanel to be easily visualized and analyzed but also ensure that the correct data is being analyzed by the correct teams, geographical regions, and project owners.
With these feature sets, we aim to help your organization forge the foundation for democratized data that is accurate, accessible, and discernible for all.
If a team member or entire teams in your organization are new to Mixpanel and excited to get started, let us take some work off of your plate. Here is a link to a collection of our Mixpanel Docs that provide quick demos for all of Mixpanel’s functionalities, along with tips and tricks to hit the ground running!
Get fast access to product, marketing, and company revenue insights for your whole team with Mixpanel’s powerful, self-serve analytics.