


Key findings from the Forrester Total Economic Impact™ study on Mixpanel

Product teams are increasingly expected to influence roadmap decisions, improve customer experiences, and demonstrate measurable business impact. Many organizations, however, struggle to connect analytics investments to outcomes such as efficiency gains, cost savings, and improved decision-making.
So, where are companies seeing real results, and how are they achieving them?
Mixpanel is the modern decision analytics platform with real-time insights, intuitive reporting, and a composable architecture that empowers teams to understand what’s working and take confident action across the entire user journey.
To better understand the economic impact organizations can achieve with modern digital analytics, Mixpanel commissioned Forrester Consulting to conduct The Total Economic Impact™ Of The Mixpanel Digital Analytics Platform in December 2025.
The study examines how a composite organization, representative of interviewed customers using Mixpanel, realized quantified benefits, incurred costs, and experienced additional unquantified value over a three-year period.
Executive summary
According to the Forrester Total Economic Impact™ study, the composite organization using Mixpanel achieved measurable financial returns over three years by improving analytics efficiency, accelerating access to insights, and reducing reliance on manual reporting and legacy analytics tools.
Key results include:
- 354% ROI and $4.9M net present value over three years
- Payback period of less than six months
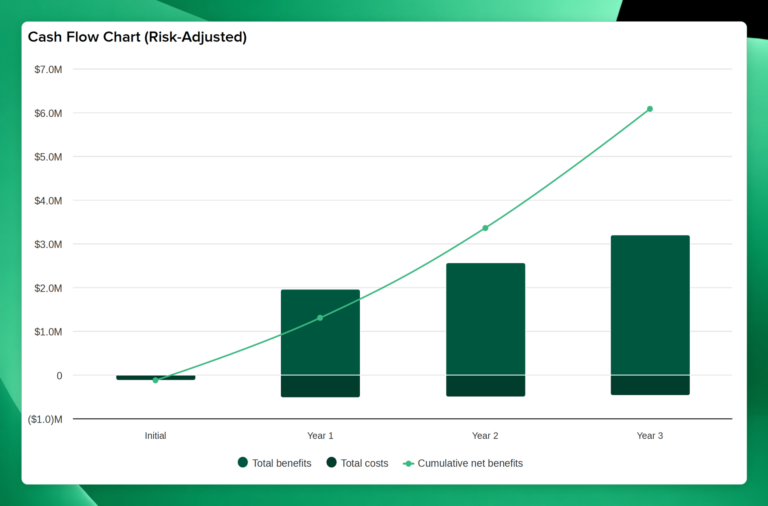
- $6.3M in total risk-adjusted present value benefits compared with $1.4M in total risk-adjusted present value costs
Total benefits
Over the three-year analysis period, the composite organization experienced several quantified benefits tied directly to its use of Mixpanel for digital analytics. These benefits were risk-adjusted and discounted in accordance with Forrester’s TEI methodology.
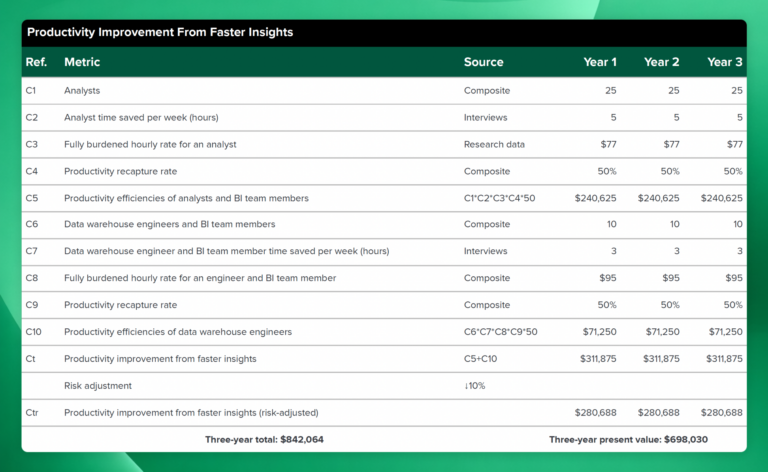
$698K in productivity gains from faster, self-serve analytics
Teams using Mixpanel reduced the time required to explore data, answer questions, and share insights with stakeholders. By enabling self-service analysis across product, marketing, and growth teams, the composite organization reduced reliance on specialized analytics resources and manual report creation.
The study found that analysts saved 5 hours per week and data operations and BI teams saved 3 hours per week by shifting routine analysis, dashboard creation, and cohort building to Mixpanel’s self-service capabilities. These productivity gains resulted in $698,000 in risk-adjusted benefits over three years.
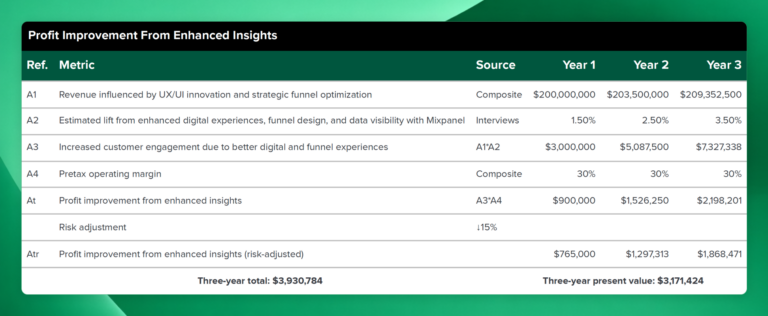
$3.2M in profit improvement from faster product and growth insights
Improved access to behavioral data enabled teams to validate hypotheses faster and prioritize initiatives with greater confidence. Product and growth leaders used Mixpanel to identify friction points, evaluate feature adoption, and assess experiment outcomes without lengthy reporting cycles.
Interviewees described using Mixpanel to analyze complex onboarding funnels, identify drop-off points, and validate UX and feature changes in real time. These capabilities contributed to $3.2 million in risk-adjusted profit improvement from enhanced insights over three years.
“Mixpanel is a best-of-breed tool to understanding … [our] onboarding funnel and how people are moving through every single piece of that funnel and where you’re losing people.”
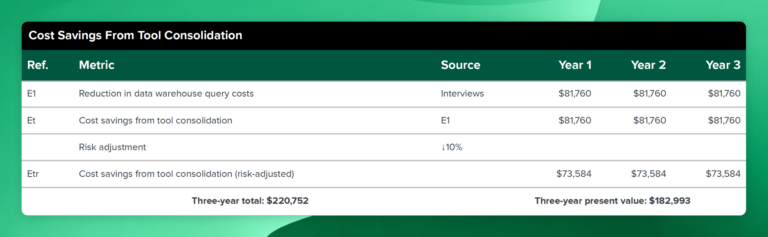
$183K in cost savings by consolidating analytics tools
By standardizing on Mixpanel as its primary digital analytics platform, the composite organization reduced dependency on overlapping BI dashboards and legacy analytics tools. Interviewees reported lower query volume in data warehouses and a reduced need to maintain licenses for separate analytics solutions.
These efficiencies resulted in $183,000 in risk-adjusted cost savings over three years.
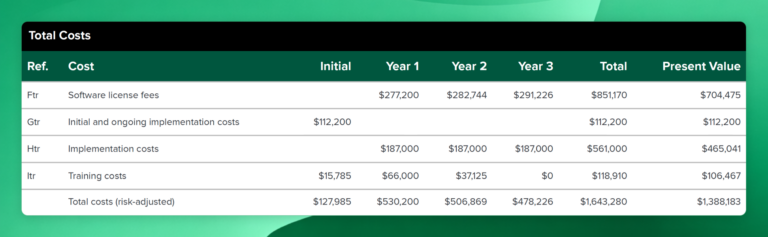
Total costs
To achieve these benefits, the composite organization incurred costs related to Mixpanel licensing, implementation, and enablement. These costs were risk-adjusted and discounted over the three-year analysis period.
Total risk-adjusted present value costs amounted to $1.4 million over three years, including:
- $704,000 in software license fees, data egress and pipeline costs
- $112,000 in initial implementation costs
- $465,000 in ongoing implementation costs
- $106,000 in training costs
$4.9M net present value with payback in under six months
When total benefits are compared with total costs, the study shows that the composite organization achieved a positive net present value of $4.9 million and a 354% ROI over three years. The payback period occurred in less than six months, reflecting how quickly efficiency gains from improved analytics workflows happened.
Additional unquantified benefits
In addition to the above, interviewees cited several qualitative benefits from using Mixpanel for digital analytics:
- Accelerated hypothesis validation and guided experimentation using real-time behavioral insights, funnels, cohorts, and experimentation features
- Improved decision-making and roadmap alignment through shared visibility into user behavior and performance metrics
- Higher trust in data supported by event standardization, governance, and validation practices
Experience unmatched levels of ROI with Mixpanel
Without the right analytics infrastructure, organizations struggle to understand user behavior, scale insight generation, and confidently guide product and growth decisions. The Forrester TEI study shows that when teams are supported by a unified, self-service platform, organizations can move faster, make better decisions with confidence, and realize measurable financial returns.
To learn more about the data and get additional context on how teams can drive measurable business value with Mixpanel, download the complete Forrester Total Economic Impact™ study.