

What is a heatmap?

A heatmap is a visual representation of data. For digital products, heatmaps use color to show users’ activity, typically employing warm colors to indicate hotspots and cooler colors to represent zones with less activity.
Businesses use heatmaps to understand user behavior on their website or app, which can be invaluable information for optimizing user outcomes. Heatmaps can display a range of information, including where users' cursors move, where on a page users click, and how far down a page they scroll.
With every single click, scroll, and hover on your website, your users are sharing valuable information. With their actions, they reveal what they value, what they need, and what they ignore. But without the right technology in place to track these subtle actions, you might be missing out—and leaving valuable optimization opportunities on the table.
Enter heatmaps. Heatmaps are a powerful tool to capture and visualize user activity, aggregating that data to glean rich insights. Do you see a bright red “hotspot” on your website’s “Resources” section? Give your marketing team some high fives. Do you see a greenish-blue “cold spot” on high-value product features in your app’s navigation? That’s an area for potential improvement.
Read on to learn more about using heatmaps to acquire, engage, and retain more satisfied customers.
Skip ahead to learn more about Mixpanel’s Heatmaps here.
What is a heatmap?
A heatmap is a type of data visualization that uses colors—usually from green to red—to represent user behavior on their website or app. Some of the information heatmaps display includes where on a page users click, how far down a page they scroll, what areas on the page they look at, and what areas they don’t engage with.
While heatmaps may feel like a modern invention, they’ve actually been around for a long time. In the late 1800s, officials in Paris used hand-drawn heatmaps to track social trends across different districts. While today’s slick digital heatmaps are a far cry from their low-tech Parisian counterparts, what remains is that they’re a visually appealing, easy-to-read method for understanding trends and improving outcomes.
What are the benefits of using heatmaps?
1. They're easy to use, but rich with insights
There’s a reason heatmaps are loved by marketers, product teams, and data teams alike: They’re extremely intuitive to interpret (unlike other methods of data analysis that require deep technical expertise).
By understanding the hot spots and cold zones on your website or app, you can surface rich insight on how your user base is behaving in a matter of seconds. Heatmaps make it easier to see which parts of your digital product require more user attention, or “heat.”
2. Heatmaps surface actionable opportunities to increase your bottom line
Heatmaps can help you uncover clear ways to optimize your website or app to meet users’ needs and desires. If you see many users trying to click on an element that doesn’t lead anywhere, you can add a link. If you notice users rarely scroll past the top third of your page, you can move conversion CTAs or important information up (or even shorten your content).
By placing the most important information where users tend to focus most—hint: this almost always follows an ‘F-shape’—you get eyeballs on your most important conversion opportunities or highest value features. Optimizing with these goals can lead to marked improvements in your customer acquisition and retention over time.
Types of heatmaps
Different heatmaps reveal different aspects of user behavior. Here are the most useful ones for software user analysis:
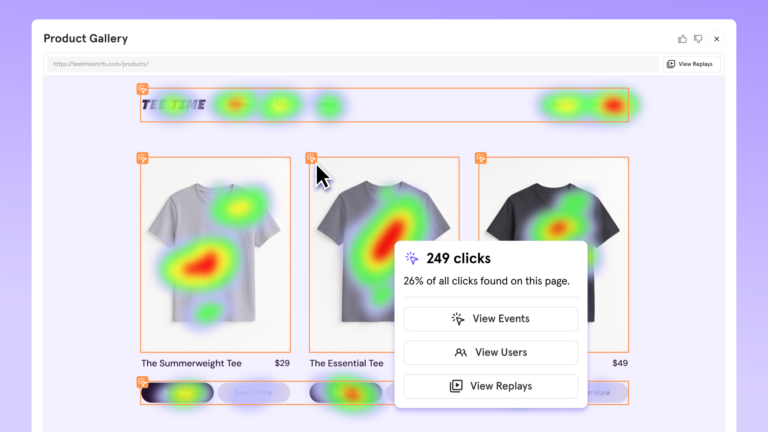
1. Click heatmaps
Click heatmaps allow you to track where users click and interact most. You can use what you learn from click heatmaps to do things like optimize button placement or maximize CTA effectiveness.
2. Scroll heatmaps
Scroll heatmaps allow you to understand how far down your users are scrolling on your pages. By understanding typical scroll depth, you can optimize where you place your most important messages, as well as tailor the page length to meet customers’ content consumption preferences.
For example, you might notice that users are rarely getting to the end of long blog posts. In that case, you can make sure you don’t bury your most important CTA at the end and instead place it after your intro paragraph.
3. Movement heatmaps
Movement heatmaps (also known as “hover heatmaps”) allow you to track mouse movement patterns to understand where your users are placing their attention and interest. If they hover for a long time in certain workflows that are designed to be quick and easy, this is likely an indication that they’re experiencing friction. You could then use this knowledge to rework your UX to be more intuitive.
4. Attention heatmaps
Attention heatmaps leverage user behavior to simulate eye-tracking and make educated guesses about where users are looking. Similar to movement heatmaps, you can understand what’s catching your users’ eye. This can help you optimize your visual hierarchy and design elements. While your marketing team might have assumptions about where your users’ attention is drawn in your resource center, nothing is more valuable than concrete proof (and also, you might be surprised what users pay most attention to).
How to use heatmaps + session replays in tandem
Heatmaps are an aggregation of the behavior and inputs from thousands of different users. They create a sort of quantitative overview of your user’s qualitative actions to help you understand trends in what’s happening on your web or app page. From a heatmap view, you’ll want to dig deeper to tell the full story, since they don’t show what users were doing before or after they took that action. That’s why it can be useful to use heatmaps in conjunction with session replays to both identify trends and get a clear picture of why those trends might be happening.
Session replays are reconstructed video playbacks of individual user sessions. While heatmaps show a snapshot of how many different users behave in one moment, session replays show a recording of one user’s full journey to get the full picture of how users are interacting with your product—and most importantly, why they’re behaving that way.
With ever-growing tech stacks, switching between tools to view quantitative data (like conversion rates) and qualitative data (like session replays) can be tedious and expensive. Mixpanel allows you to identify issues in Heatmaps and then jump directly to view individual recordings showing that issue in Session Replay—all in the same platform, without interrupting your workflow.
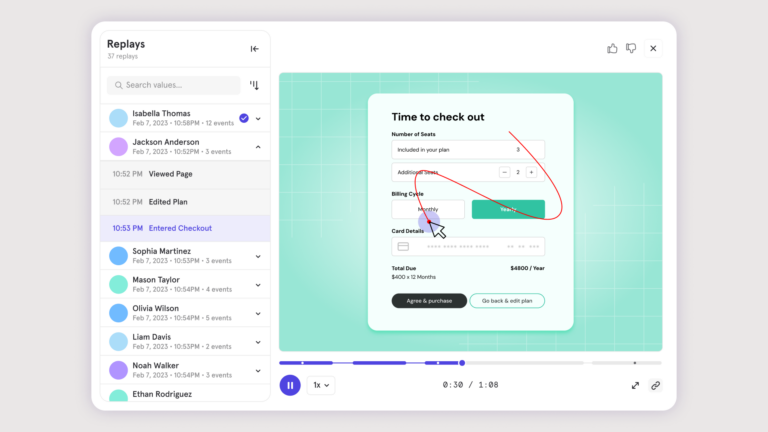
For example, you notice a low conversion rate on a landing page. A heatmap can show you where users’ attention is drawn and whether or not they even scrolled or clicked in the area of your CTA. If they never reached your CTA, you’ll want to rethink its placement. But if it’s clear they saw your CTA but didn’t click, perhaps you want to rewrite your CTA copy. Then with Session Replay, you can dive a layer deeper by viewing sessions of users who didn’t convert and watch a recording of their behavior to understand more.
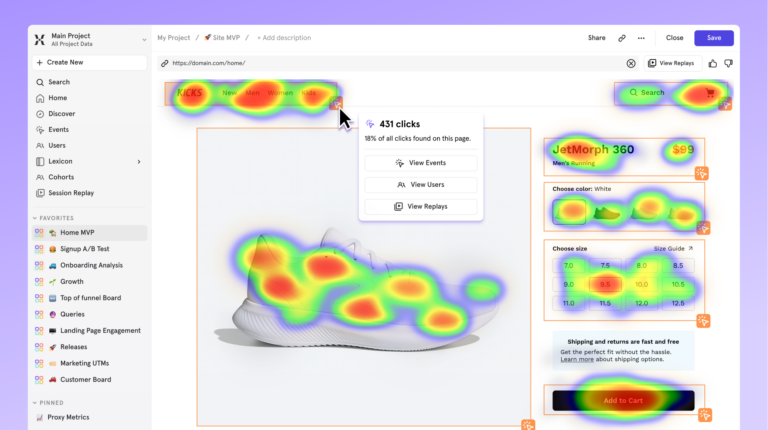
Mixpanel’s Heatmaps: Joining quantitative and qualitative analysis
While standalone heatmaps tend to only show high-level trends, Mixpanel’s Heatmaps integrates with product analytics so you can connect insights to funnels, retention, and conversion analysis. This functionality helps you not just extract insights, but use them to acquire and retain more customers.
Mixpanel’s Heatmaps offers real-time insights so you can immediately access behavior patterns as users engage with your website. It also has advanced segmentation capabilities so you can access heatmaps that are specific to certain user cohorts, acquisition channels, or behavior patterns. What’s more, Heatmaps goes beyond just visual data—our combination of heatmap visualizations with event-based analytics gives you a fuller picture of your user journey.
Pro tip: Combine session replay with heatmaps without leaving Mixpanel—so you can see the "what" and the "why" all in one place!
Learn more about Mixpanel's Heatmaps here and uncover the “why” behind user behavior—faster.
Try heatmaps today
Heatmaps have become an essential tool for product and marketing teams who want quick, visual insights. They don’t require technical data analysis skills and they give you access to real voice of customer data—without the time, expense, and inconvenience of interviewing individual customers or even watching a needless amount of their session replays. They're also quick and easy to implement in Mixpanel, and after a short setup process, your teams can uncover actionable insights in no time.
By uniting your funnel, conversion, and retention data with an intuitive visual platform, you can gain a deep understanding of customer behavior. Ultimately, this insight gives you the power to turn more clicks into satisfied customers.
Stop wondering; see how your users actually interact with your product. Get started with Mixpanel’s Heatmaps today and uncover insights that drive real improvements to your user experience.