How product analytics helps companies navigate uncertain times
The economy was in the midst of a bounceback at the start of 2022. Across industries, we saw record-high company valuations and a renewed sense of optimism. But as we’ve learned over the last few years, anything can happen.
In 2020, there was an unfathomable global pandemic. Now, we are seeing high inflation, increasing interest rates, war in Europe, and signs that we could be headed for a recession of an unknown duration.
During uncertain times, capital becomes even harder to come by and leaders at companies big and small must think twice about how they deploy their resources. Making the necessary tradeoffs is really difficult and that’s where product analytics can become indispensable. It shows companies what is and isn’t working with their products, what to prioritize, and what to invest in.
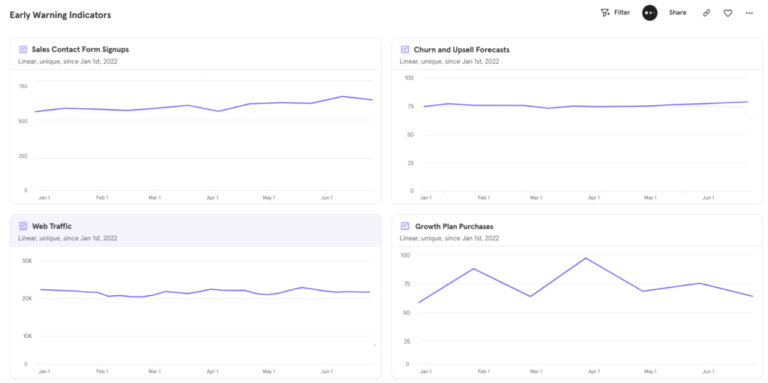
At Mixpanel, we’ve created a product-analytics dashboard to spot and help us remedy issues that could arise from a recession, as well as identify opportunities to go on the offensive and increase market share. When I shared the dashboard during our company all-hands, Arthur Cilley (Strategic Sales Engineer) suggested we open it up to everyone so that others can benefit from it ❤️. If this framework resonates and you want to learn how you can replicate it, please drop me a note amir@mixpanel.com or check out our resources at mixpanel.com. I’m genuinely excited to help share how we’re approaching the current macroeconomic uncertainty and provide some practical steps you can use to best prepare and navigate through it.

The early-warning signals we’re tracking
We are tracking a handful of early-warning signals or metrics that will alert us to a recession that negatively impacts our business. For example, one of the lessons we learned during the pandemic is that negative economic effects can be identified in leading demand indicators for our product.
From March 1, 2020, to March 15, 2020, our number of weekly new users decreased as the pandemic hit. But by April, signups surpassed March 1 levels. A real recession could be a completely different story. Where the 2020 pandemic’s impact was immediate and severe, a path to a recession would likely be a gradual, sustained decline that could last much longer.
We’re also likely to see impacts vary by company size and region. For example, we could see demand from startups decline before more mature businesses. We could see a geographic divergence based on many factors leading up to today and local response after the downturn. But again, anything can happen, which is why we are tracking a number of metrics to give us a comprehensive view of our business. Here are all of the metrics we’re tracking, and why:
Tech ecosystem metrics
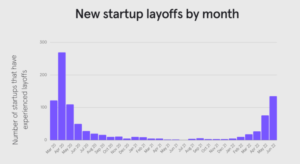
- Tech layoffs from the Layoffs.fyi tool – Layoffs are a key indicator of economic health. Tracking layoffs in the tech sector from Layoffs.fyi gives us insight into whether companies in our sector have healthy balance sheets and available resources.
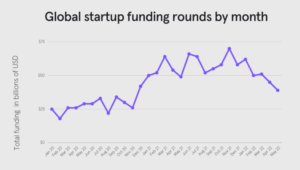
- Funding rounds closed from Crunchbase – Funding rounds are a key indicator of economic health and appetite for risk in the tech sector. During previous downturns, the number of funding rounds decreased, so tracking funding rounds is a good way to judge market conditions.
Demand metrics
- Web traffic – The number of people visiting our website or app is a good top-level indicator of awareness of Mixpanel.
- Signups and people who’ve asked to be contacted by sales – Further down the funnel, the volume of people who have signed up for Mixpanel and requested sales contact them shows how well we are attracting new users and businesses.
- Growth plan purchases – Our Growth Plan is one of our most popular introductory plans. Tracking the number of purchases made gives us a baseline for the level of demand for our product.
- New business forecasts – Including forecasts for new business helps guide our expectations.
Customer adoption and retention metrics
- Percentage of paid customers and percentage of Annual Recurring Revenue with healthy adoption – We have a threshold for how many weekly active users an account should have for us to consider them very unlikely to churn. We are tracking the percentage of our paid customers and percentage of Annual Recurring Revenue that meets or exceeds this threshold.
- Churn and upsell forecasts – We input our forecasts for churn rate and potential upsells to track our customers’ retention and expansion rates.
The importance of a contingency plan
We are closely monitoring each of these metrics. But metrics are only half the battle. It’s equally important to establish a contingency plan. If we see a positive or negative impact to our business, we’ve developed a contingency plan with clear, simple triggers so there will be no ambiguity about whether we need to shift gears. While I won’t share the details of Mixpanel’s contingency plan, I do want to highlight our contingency plan triggers.
A recession would likely impact demand first as various companies tighten new spending. That’s why we’ve established signups and people who’ve asked to be contacted by sales as our triggers. Our contingency plan would only be triggered if we thought that we could not sustain our fiscal plan with the demand levels we observe.
It’s important to note that some months are better than others. As long as the overall trend of each metric is still moving towards our targets, a slow month here or there won’t trigger our contingency plan. A simple rule of thumb is that we will shift to a contingency plan if in any month either of our two metrics is more than twice the standard error below its target.
What we’re seeing so far
Tech ecosystem metrics are already showing signs of an economic slowdown: tech layoffs are up, and funding rounds are down. Crunchbase has reported an increase in layoffs and hiring freezes corresponding with a slowdown in venture funding.


These metrics point to a potential recession on the horizon. But it’s too soon to sound the alarm. We’ll continue to monitor our dashboard and triggers closely. As things progress, we may evolve our dashboard; perhaps by adding new early-warning signals. We’ll continue to share our learnings here to help other leaders who are navigating their companies through uncertain times.
If you’re interested in developing a comparable dashboard of your own, please don’t hesitate to reach out – ping me at amir@mixpanel.com or check out our resources at mixpanel.com. If you do reach out, I’m also happy to share the contingency framework we’re using. Making these dashboards available to all employees internally is of course optional, but I encourage it because it empowers everyone at the company to make more informed decisions.
Because Mixpanel is highly customizable, we can help you fine-tune your dashboards and early-warning systems to meet your company’s specific needs. Tracking this data can help your company develop resiliency and take advantage of new opportunities.


