How to improve conversion rates with user analytics
Mary was only two clicks away from making a purchase. After 30 minutes of browsing on her iPad, she was convinced the new cognac-colored boots would complete her fall wardrobe. It was the style she was looking for: soft Italian leather, an angled block heel — a trendy take on a classic shape. The store guaranteed free returns. But Mary hesitated and bounced from the website, leaving the cognac boots in the virtual shopping cart. What happened?
The average online shopping cart abandonment rate is at 69.57%. That means 7 out of 10 shoppers are like Mary. From the first visit to adding credit card information and confirming the order, all businesses have critical conversion paths. For eCommerce businesses, it’s the path to purchase, for a subscription service, it could be the path from free trial to premium — or another series of meaningful actions that drive business value.
Even though it’s obvious that conversion matters, measuring and improving it isn’t easy. It requires meticulously digging into the user behavior and segmenting it in every possible way: by platform, plan type, acquisition source, and beyond. From learning about where users drop off to discovering what makes them convert and why, this article includes the questions you need to ask to improve your conversion rates. The best part? We’ll show you how to get the answers quickly and easily in Mixpanel.
1. What’s my conversion rate?
To understand your conversion rate, use Mixpanel’s Funnels report to follow your users through the critical steps to purchase. At each step, you’ll see the percentage of users who successfully moved from one step to the next (for example, moved from adding a product to their cart to completing the purchase). You can easily add or remove steps at any point of time and change the date range. The report is also “retroactive” so the funnel will adjust historical data on the fly (as long as the data you include was tracked at the time).
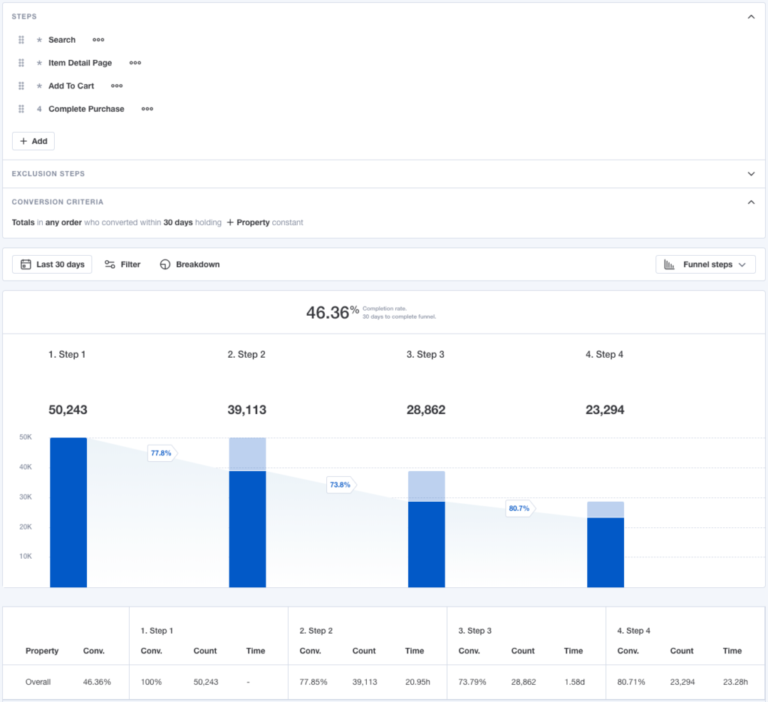
You can look at the conversion data from several different angles to get a broader perspective on what’s happening:
- By uniques
By default, the Funnels report accounts for the number of individual users who entered the funnel. If a user did something more than once, Funnels will count those actions as one. - By totals
This view represents the total number of user interactions across the funnel, whether they came from the same user or not. A single user, for example, can make multiple orders. By counting totals, you can understand this repeat purchase behavior. - Any order
Any-order funnels show the conversion rate for all users in your funnel—regardless of the sequence of steps they take. For example, some users search, then click on a specific item, then buy. Others click on an item they like from the home page, then search for a similar product in a different color or style, and then buy. Any-order Funnels can show you conversion rates for all combinations of your funnel steps.
Mixpanel also shows how your conversion rates are trending over time. For example, you can monitor the change in percentage of new users who upgrade to a paid account— or how many people successfully input credit card information after clicking “Add to cart.”
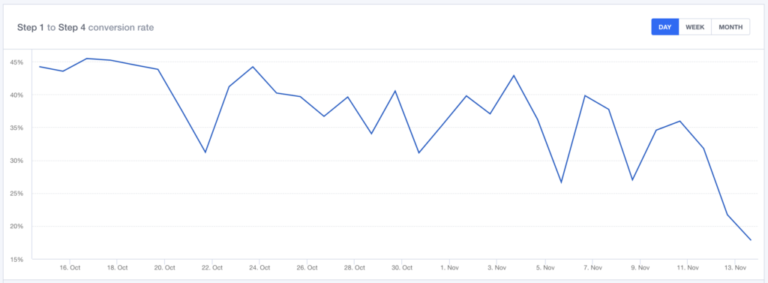
Finally, you can set up alerts and get notified if your conversion rate is above or below the norm. Custom email alerts will help you act quickly, whether it’s taking advantage of the spike or identifying and fixing what caused the dip.
2. Which channel or geo converts the best?
Scaling up your acquisition involves constantly looking at how your marketing dollars convert into business value deeper in the funnel. It’s the only path to sustainable growth. As Andrew Chen, Silicon Valley’s most famous growth expert, says, “startups die from their addiction to paid marketing,” often because they are blinded by the average customer acquisition costs across all channels. Instead, marketers need to understand the CAC (customer acquisition cost) for each channel and dig deeper into how each channel performs across the funnel.
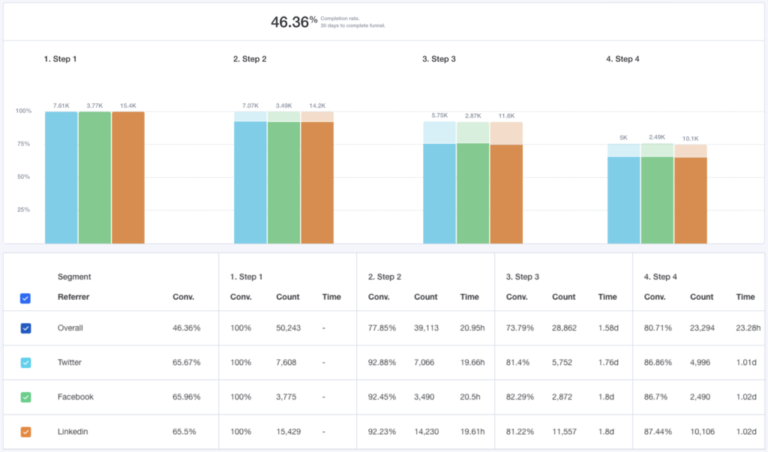
A funnel that compares your conversion rates by referrer will quickly uncover the weakest and the strongest links in your acquisition strategy. At a glance, you’ll know whether to scale your investment in Twitter, Facebook, or, perhaps, LinkedIn in order to see the best results. At the same time, you can slice this data by geo to see how best to distribute your spend globally.
3. Why is my conversion low?
Do you know a product or growth team that is satisfied with their conversion rates? They either don’t exist or have moved to a less-competitive profession (or will soon have to). Conversion rates are never high enough—at least not when your business operates in the free market. Understanding the root cause of low conversion rates helps you figure out what to fix in your product or growth strategy in order to generate more revenue.
Visualizing how users move through the funnel and where they drop off can uncover key areas for improvement. Mixpanel’s Flows report does exactly that, showing the various paths people take on their way to converting—and highlighting the places where people drop off.
For example, Gekko, an accounting platform, used Mixpanel to learn that many users dropped off when it was time to provide their personal information, and developed a new design that drove a 58% increase in sign-ups. Similarly, Resy, a restaurant reservation company, discovered that users wouldn’t complete restaurant reservations that required them to confirm the booking through email. Armed with this data, Resy switched to text message confirmations and saw much better results.
By comparing users who convert and don’t convert, you can see which actions are different for these two segments. For an eCommerce store, perhaps you’ll find that people who use Guest Checkout convert less frequently than registered users—and next time, nudge them gently towards the sign-up event with a shorter registration form—or by offering a discount they won’t resist.
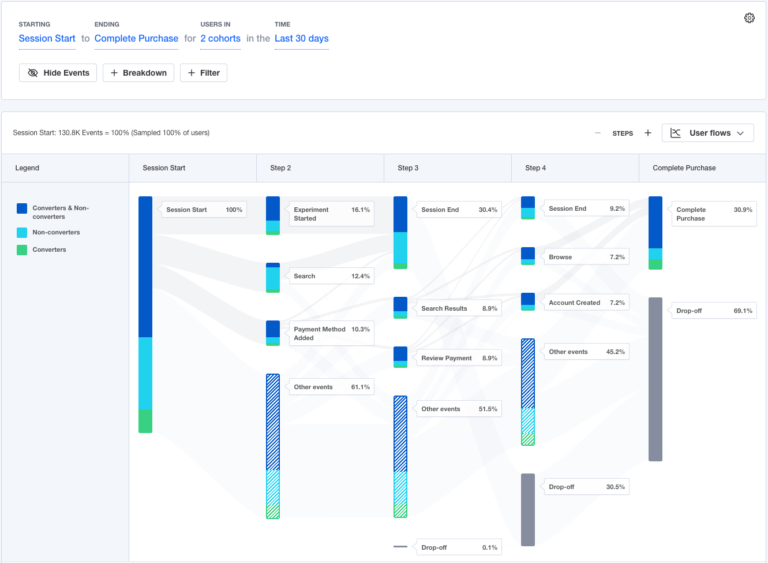
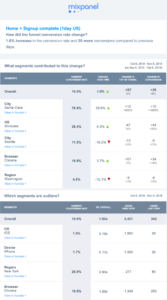
Analyzing typical user flows is a good starting point for understanding why your conversion is low. To go deeper into your analysis, you can use Mixpanel’s “Find Interesting Segments” feature. Powered by machine learning, this analysis can reveal outlier segments. For example, you might discover that first-time customers using the Opera browser convert at a lower-than-average rate. Perhaps, the payment options don’t display well for these users or the free shipping message gets hidden, or something else—whatever the reason, this ML-driven ad hoc analysis will give you plenty of hypotheses to test.
Once you know what these outlier segments are, you can send them targeted messages—either within Mixpanel or through one of our messaging partners—with specific CTAs to avoid drop off.
To improve your conversion rate, you first need to accurately measure it. With Mixpanel, you can define your custom conversion metric and see how it’s trending over time, and also understand where your best-converting users are coming from (by acquisition source or geo) and why some users drop off (with Flows analysis and Find Interesting Segments.)
This way, fewer items will be left in virtual shopping carts because of website crashes, time-outs, or unclear shipping policies, and more customers will quickly dissolve any lingering hesitations about a new pair of cognac leather boots—or anything else they fancy this fall season.
Check out these resources to learn more:


