

Revenue analytics explained: Transforming data into profit

Revenue analytics encompasses all of the tools and processes used to collect and analyze revenue data. That means tracking revenue metrics like monthly recurring revenue and average order value, but also using integrated analytics to tie product, marketing, and growth metrics to revenue and understanding the impact they have on profitability.
At most companies, revenue analytics is broken.
While product, marketing, sales, and services teams all work toward efficient revenue growth for their companies, most of the time, they’re each chipping away at this shared goal from within different verticalized tools (Salesforce, Marketo, Zendesk, etc.). This results in disparate analyses, each limited by the narrow view of only the data each team manages—and never mind that these workflow tools tend to offer analytics as only a minor feature.
The solution? A shared source of truth where everyone can collaborate and interrogate revenue data that is accurate, easy to access, and visible in real time.
This explainer will cover what revenue analytics is, its benefits and challenges, some steps for implementing revenue analytics in a dynamic analytics platform like Mixpanel, and which metrics to track.
That’s a lot of ground to cover, so let’s get started.
What is revenue analytics?
Revenue analytics involves collecting and analyzing revenue data. It includes tracking metrics such as monthly recurring revenue (MRR) for SaaS companies and average order value (AOV) for ecommerce. Additionally, it integrates various analytics to connect product, marketing, and growth metrics to revenue, helping businesses understand their profitability.
It’s Business 101 that companies need revenue to survive, and they need to increase their revenue to grow. In recent years, there has been a bigger push for revenue teams—sales, marketing, and customer success—to work in alignment under a single RevOps umbrella, and many top companies have hired a Chief Revenue Officer to break down silos and streamline revenue operations across the customer lifecycle.
But revenue teams aren’t the only ones that care about profitability. Everyone from company executives to the product team can have an impact on revenue through strategic decisions, product updates, and operational optimizations.
And of course, revenue impacts everyone at a company—without revenue, no company. Using revenue analytics to analyze, understand, and ultimately grow company revenue is crucial for any business.
Benefits of revenue analytics
Effective revenue analytics and a deep understanding of data will give companies an advantage that they can’t afford to ignore. Every opportunity to increase revenue counts, and even small incremental increases will compound over time. Here are a few of the benefits of revenue analytics.
Improve understanding of your customers
Revenue data gives you insights into how your customers are behaving and what they care about. With the right analytics, you can gain insights into spending habits, purchase history, recurring purchases, average order value, and what actions they took before churning or upgrading. All of this information shows you potential additional revenue opportunities.
Identify sales opportunities
Revenue analytics give you better insights into sales performance and product performance, which will help identify sales tactics that work (and flag ones that don’t), uncover new or underserved market segments, and spot potential revenue sources that haven’t been tapped yet.
Optimize revenue forecasting
Revenue forecasting relies on in-depth, accurate data—the better the data, the better the forecasting. Revenue analytics will improve forecasting with real-time, accurate insights into both company performance and market trends.
Increase recurring revenue
Whether you work at a SaaS company looking to increase retention or an ecommerce company trying to encourage repeat purchases, revenue analytics is a key tool in your arsenal to understand which customers are staying, why, and how to nudge into the actions you want.
Common revenue analytics traps to avoid
Leveraging revenue analytics is crucial—but that doesn’t mean it’s always easy. There are a few pitfalls to avoid when you’re first getting started with revenue analytics.
If your revenue data is siloed—stuck in different tools, serving different teams—you won’t be able to gain the insights from it that you need. Companies that want to implement revenue analytics need to make the data to do so available across the company. Most importantly, revenue data should be stored in one place (for most companies, that’s their data warehouse) which serves as a single source of truth.
When [product teams] jump from one project to the next without optimizing those products to meet revenue goals, the company will run into the same problems again and again. This process creates debt without value.
Historical data is valuable, but it only tells part of the story. When it comes to revenue, everything from market trends and emerging competitors to plain old seasonal variations can affect revenue and throw off projections. Accurate revenue analytics relies on real-time (or near real-time) data, iteration, and ongoing analysis to be useful, and you need to use tools capable of supporting that analysis.
How to implement revenue analytics
While every company's revenue analytics needs look different, there are some basic steps that most teams will implement when getting started with revenue analytics:
Step1: Data collection
Let’s start with the obvious: To analyze revenue data, you first need to collect that data. The first step is making sure that your entire company is using a single source of truth for revenue data—as we mentioned above, most companies use their data warehouse for this purpose. If the data resides in different tools, you risk introducing errors with every slight variation, and analysis based on faulty data is useless.
Step 2: Data analysis
Once you’ve gathered your data in one place, you need the right tool or platform to analyze that data. Analysis requires more than looking at a dashboard: You need tools and processes that allow you to interrogate your data and dive deeper into what you see. With the information you have, you can come up with a hypothesis for why something is happening.
Step 3: Glean actionable insights
Once you’ve analyzed your data, you can use that information to come up with actionable insights and ideas to test to increase revenue. Maybe you spot some opportunities to increase average deal size or lean into a high-converting segment.
Step 4: Take action
Try out your optimization ideas and see how they perform. Your revenue analytics dashboard will help you see spikes and dips in performance quickly.

Step 5: Repeat
Revenue analytics gives you the information you need to find opportunities to increase revenue—but only testing those theories will show you what really works and what doesn’t. Using revenue analytics to increase revenue is an iterative process, and you need to experiment to get it right.
The revenue analytics metrics you want to track
Organizations can (and should) track many different metrics to measure performance. But that doesn’t mean that all metrics are created equal: Some will tell you more than others about your company’s revenue performance and growth.
Even more importantly, different business models will prioritize different metrics. Here are a few of the revenue metrics that matter most for any organization, followed by a few key metrics that different types of businesses should track.
- Gross and net profit
These are pretty self-explanatory, but also important enough to bear mentioning. Your gross profit is all of the revenue you generate. Your net profit is revenue, minus all expenses (tools, salaries, etc.).
- Closed-won rate
The closed-won rate is the number of deals a salesperson closes compared to the total number of sales opportunities. For example, if the sales team closes 30 deals out of 100, the closed-won rate is (30/100) * 100 = 30%.
Closed-won rate is a sales performance metric, and as such it's more important for sales-led growth companies.
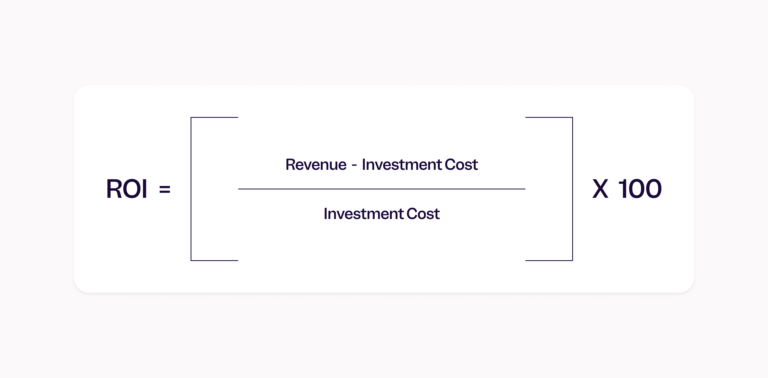
- ROI
ROI, or return on investment, is the measure of an investment’s performance—including investing in a project, like a new product feature or a marketing campaign.
Revenue metrics for transaction business models
Transaction-based business models (like ecommerce or financial services companies) sell products or services one purchase at a time. For these businesses, revenue depends on increasing order value, encouraging repeat purchases, and attracting new customers. Here are a few of the most valuable revenue metrics for transaction-based businesses:
- ARPU (average revenue per user)
Average revenue per user helps you understand the profitability of a product, based on the money generated from a user or subscriber. ARPU is easy to calculate: total revenue/total number of users
- AOV (average order value)
Average order value is self-explanatory—it refers to the dollar amount spent on an average order or purchase of a product. You calculate AOV by dividing total revenue by total number of purchases.
- LTV (lifetime value)
Lifetime value is the cumulative spend from a user over time on your product or platform. For transaction-based businesses, LTV is often defined as ARPU in the first 30 (or XX) days x Avg lifetime (in months) of a user.
- CAC (Customer Acquisition Cost)
This is the amount a company has to spend (on marketing, advertising, etc.) to acquire a user.
A sign of a good acquisition strategy is when LTV/ CAC > 1.
Revenue metrics for subscription business models
Subscription-based models like SaaS companies focus on retention and upsells to existing customers.
NRR (Net revenue retention)
This metric shows how revenue has changed over a specific period.
- NRR > 100% → existing customers are being retained + growing
- NRR < 100% → existing customers are a leaky bucket
The formula to calculate NRR is: current MRR from existing business / prior MRR
MRR and ARR (Monthly and annual recurring revenue)
Monthly and annual recurring revenue are the basis of any SaaS or subscription business model. They’re fairly easy to calculate:
- MRR: Number of monthly subscribers * average revenue per user (ARPU)
- ARR: Number of annual subscribers * average revenue per user (ARPU)
MRR churn
MRR Churn looks at existing customers and how that revenue has dropped, without considering upsells.
The formula for calculating MRR Churn is: (current MRR from existing business - upsell MRR)/ prior MRR
MRR growth rate
MRR growth looks at overall growth in MRR (including upsells). The formula is: current MRR / prior MRR
LTV
Lifetime value is at least as important for SaaS customers as it is for purchase-based companies because acquiring a new customer is much more expensive than retaining one.
The formula to calculate customer lifetime value for SaaS is average revenue per customer * customer lifetime.
Revenue analytics goes beyond revenue metrics
Nearly every team at your company has an impact on revenue: A glitchy product will cause users to churn, a poor marketing campaign will have low ROI, and a poorly-trained sales team will cost you deals.
That’s why analyzing revenue goes beyond revenue metrics: you need a platform that ties together product analytics, marketing analytics, and all of your business data in one place so that you can see how each action impacts revenue and which levers to pull to improve performance.
How to choose the right revenue analytics software
For companies that want their different teams to be aligned on revenue goals, it’s important to choose revenue analytics software with an intuitive interface that even non-technical employees can understand easily, without sacrificing the features needed to perform useful, insightful analysis. Dashboards that anyone can view and make it easier for teams to collaborate, and help break down data silos.
Because revenue data can change so quickly, you need an interface in perfect sync with your warehouse data, so that you can rely on your analysis to make accurate, up-to-date decisions—that’s exactly what Mixpanel's new Mirror and Profile History features allow you to do.
Learn more about all of Mixpanel’s revenue analytics features here.