
Meet Mixpanel Boards: a better way to collaborate

Being data-driven is hard, but it shouldn’t be a lonely endeavor.
We’re excited to introduce Mixpanel Boards, which replaces our existing dashboards with an expressive workspace for collaborative, aligned decision-making. Unlike an inflexible dashboard that only shows metrics, Boards empowers teams to share complete context, dig into the data, and make better decisions together.
What’s included in Boards:
- Text cards: Add text to share the reasoning behind tracking any metric (with support for rich text formatting!)
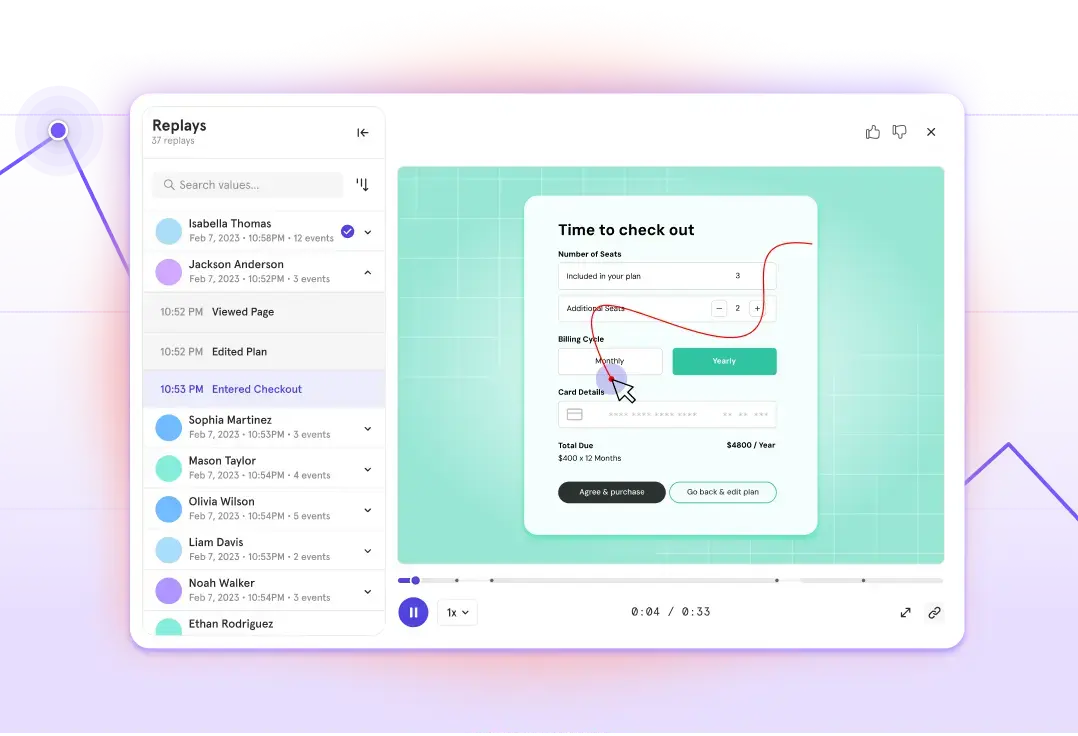
- Media cards: Give more color with a screenshot or feature walkthrough with YouTube, Vimeo, or Loom, or just spice things up with great memes
- Adjustable card height and width: Insert, drag, and resize cards to make your analyses more organized and readable
- Viewer transparency: Hover over the top right corner to quickly see who has recently viewed your Board, so you can know your impact
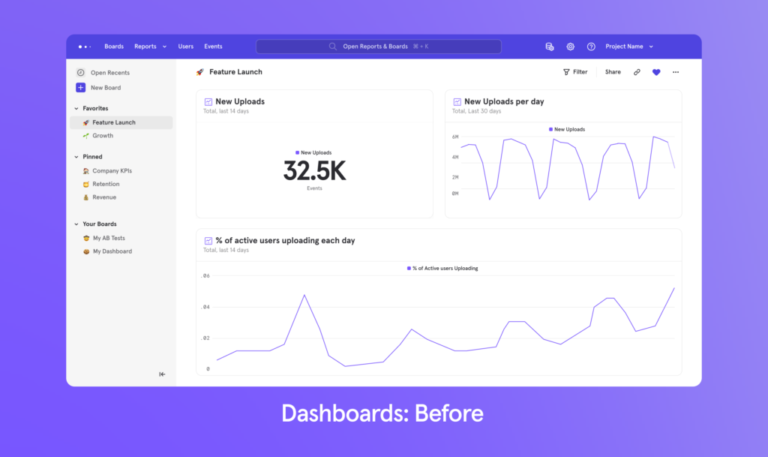
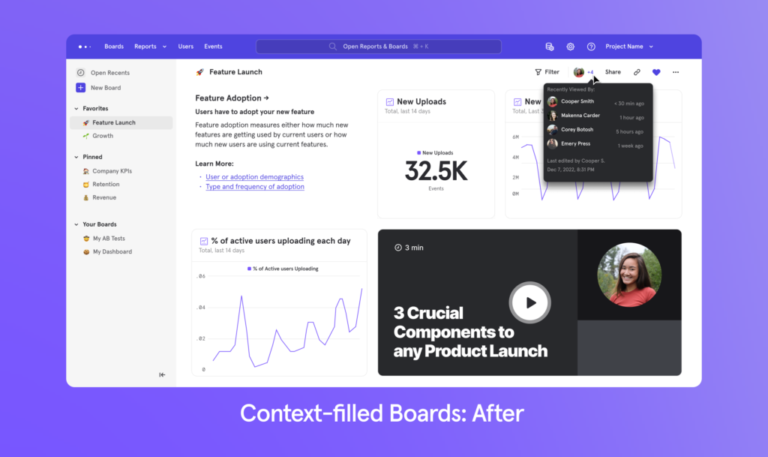
Before and after
Metrics in a vacuum aren’t very useful for collaboration. Typical dashboards in the industry only show reports that lack context for others to understand why certain metrics matter. For example, perhaps you have a KPIs dashboard pinned in a team channel. If somebody wants to learn why you’re tracking this way, they’ll have to scan messages or wikis to understand the analysis.
With Boards, you can share sophisticated, contextualized metrics with stakeholders to get aligned quickly. When everyone knows what is being measured and why, the whole team is empowered to make better decisions and innovate faster.
“I really like how Mixpanel Boards now supports the embedding of Looms alongside the data. Video and the storytelling it supports not only provides context but makes data more accessible and engaging across our organization.” — Steve Lucas, Group Product Manager at Remote
Example use cases
When testing these new features out, it may be tempting to just throw a good meme in. While we love making Boards more interesting to read, here are a few more ideas of how to collaborate better using Mixpanel.
Teach others how to interpret top-line product KPIs
If you operate as we do at Mixpanel, you might have a team page in your docs tool. It’s the perfect place to pin a Board with key product metrics for your team.
You can use our text cards to share guidance on how to interpret critical data or the reasoning for why you are measuring success a certain way. For example, if you have a report tracking WAUs, you can clarify that WAUs is your North Star metric and is defined as any user who takes a ride during a week.
Collaborate on identifying a problem area and opportunity
The best product decisions aren’t made by one person staring at endless streams of numbers. You can use Mixpanel to trace your thinking on what to build next, backed by user data, and share that context with the broader team to influence planning.
For example, you may discover that there is one critical action that catapults someone from being an average user to a power user. You can build a Board with your hypothesis on optimizing this critical workflow, complete with supporting data and potential design mockups. From there, you can propose it at your next product planning session.
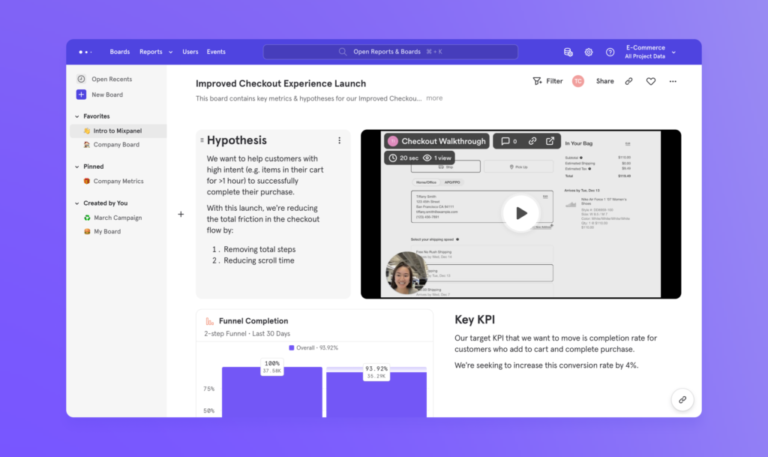
Debrief the impact of a successful launch
Just shipped a new feature? You can use text cards to write out the hypotheses for the launch and an explanation of the results. Create a highly organized, readable Board with section headers—such as feature adoption (”are users discovering this feature?”) and feature retention (”do users who use this feature use it again?”)—and place reports in the corresponding section. You can also share a product screenshot or video walkthrough of the feature change you made.
Now when execs ask how that product launch went, you can just send them a beautiful Board loaded with context and explanations. They can immediately see how the analysis led your team to a high-impact launch.
Explain unexpected changes to the broader team
For some reason, one of your core features recently experiences a dip in usage. After noticing this change, you want to explore what happened and monitor it closely, as well as give context to stakeholders who may be involved.
You can create a new Board with breakdowns of the feature across different cohorts and use text cards to make it complete with takeaways, hypotheses, and suggestions. This way you can share the Board with the team to raise the issue, influence their perception, and start problem-solving faster.
Getting started with Mixpanel Boards
The great news is that Boards is completely free and generally available for all users so you can jump in right now to explore your data. If you’re new to Mixpanel, check out our example Intro to Mixpanel Board that showcases the functionality.
If you’re loving updates like Boards, stay tuned for what’s next. As we mentioned in our recent product vision post, we’re continuing to invest in making product analytics more usable, trustworthy, and affordable for everyone. Boards is a great example of how we’re building powerful product analytics everyone can use.