What is ARPU?
ARPU, or average revenue per user, is a metric that captures the smoothed-out revenue that a company generates per user, usually calculated on a monthly or yearly basis.
Different industries and business models will have different ARPUs. There is no universally “good” ARPU score, but ARPU is one of the metrics that companies can use to benchmark against their competitors. Investors and VCs also use ARPU to gauge the health of a company and decide whether to invest.
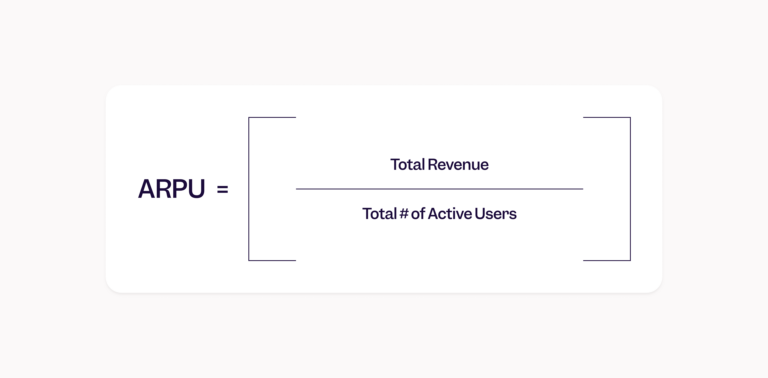
The formula for ARPU is simple: total revenue divided by total number of active users in a specific time period = ARPU.
ARPU is an important revenue metric for digital businesses, including SaaS, ecommerce, and media companies. ARPU is one of the keys to understanding customer value and analyzing company revenue.
Let’s take a look at what ARPU is, how to calculate it, and how it ties in with other revenue metrics.
What is ARPU?
ARPU is the average revenue of a company per user, usually calculated on a monthly or yearly basis.
Different industries and business models will have different ARPUs. There is no universally “good” ARPU score, but ARPU is one of the metrics that companies can use to benchmark against their competitors. Investors and VCs also use ARPU to gauge the health of a company and decide whether to invest.
ARPU is especially useful for companies that rely on a subscription model, like those in SaaS and media, and those with large customer bases as one sees in ecommerce.
How to calculate ARPU
The formula for ARPU is simple:

ARPU = Total revenue divided by total number of active users.
If a company makes $10,000 per month with 1,000 users, ARPU is 10,000/1,000 = 10.
A different company also making $10,000 per month with only 100 users would have an ARPU of $10,000/100 = 100.
In the second scenario, each user is generating 10x more revenue per month for the company.
Why ARPU is important for product leaders
ARPU tells you how much value each user generates for your business, thereby guiding decisions on pricing strategies, marketing campaigns, or even product roadmap. ARPU is also a good indicator of product and company health.
ARPU can help product leaders understand trends in both user profitability and revenue, as the metric goes up or down over time. As mentioned above, two companies with the same revenue of $10,000 per month can have very different ARPUs, which can tell you a lot about how much users are willing to invest in your product and how much value they’re getting from it.
How product leaders can use ARPU
Comparing ARPU across different user segments can help you identify your most high-value user groups (in this case, the ones with the highest ARPU).
You can then use that information to tailor marketing campaigns and cross-selling campaigns or dig deeper into the events and behaviors tied to these high-value segments. With those insights, you can build strategies to try to nudge more users to take those actions.
Finally, tracking ARPU can help you evaluate the success of product changes and marketing campaigns.
ARPU vs other revenue metrics
To get a holistic view of your product’s performance, you probably want to track a range of revenue-related data. Here’s how ARPU relates to other key revenue metrics.
ARPU vs. LTV
Both ARPU and customer lifetime value (LTV) give insights into how much revenue users generate for the company. The difference is that LTV looks at how much revenue on average a company can earn from a user throughout their entire relationship with that company, and ARPU is usually calculated monthly or annually.
ARPU indicates short-term value, whereas LTV focuses on retention and revenue in the long term, which makes it especially useful for revenue forecasting. Together, they can help you spot gaps you might not otherwise see.
For example, a company might have high customer acquisition rates and onboard lots of new paying users (high ARPU) but suffer from high churn rates and have trouble retaining customers (low LTV). Looking only at ARPU as an indicator of company performance would mask that problem, but comparing ARPU and LTV helps pinpoint the issue.
ARPU vs. ARPPU
ARPPU, or average revenue per paying user, shows you how much revenue each paying user is generating for a business.
ARPPU is calculated similarly to ARPU:

Total revenue divided by number of paying users = ARPPU.
ARPPU is especially useful for businesses with a freemium model, where the basic features of your product are available for free and more functionality is available only to paid subscribers. ARPU can be skewed if a small number of high-value paying users are contributing the most revenue to your business. ARPPU takes that into account, and comparing both metrics offers a more detailed picture.
ARPPU also allows you to segment paying users and analyze their behavior or characteristics so you can identify lookalike audiences or try to nudge more freemium users to make the switch to paid.
Common pitfalls in ARPU analysis
Using ARPU requires a deep understanding of your customer base and your product (or service). It’s easy to misinterpret ARPU trends if you don’t look at the context—as we mentioned above, different industries, regions, and business models will have very different “good” ARPUs, so comparing them will be like comparing apples and oranges.
Looking at ARPU without taking into account other data points is also suboptimal, as we saw in the examples with LTV and ARPPU above.
How Mixpanel helps analyze ARPU and drive revenue insights
Product analytics platforms like Mixpanel have powerful functionality to support real-time tracking of revenue metrics, including ARPU. Features like cohort analysis give you insights into the demographics and behaviors of high-value users, and you can use dashboards to visualize ARPU alongside related metrics like churn, LTV, and ARPPU—as we do in our public ecommerce KPIs dashboard, for example.
Start tracking ARPU today to gain valuable insights into your revenue and your customer base. Discover how Mixpanel simplifies revenue analytics.


