

What is product analytics? A complete guide for 2026

| Product analytics is a discipline and a category of software focused on understanding how users interact with a digital product. It tracks discrete user actions—events—and uses that behavioral data to answer questions about user experience, feature adoption, retention, and conversion. |
Product analytics has changed more in the last two years than in the previous decade.
Two converging forces are reshaping a discipline once characterized by weekly dashboards, data tickets, and static reports: the shift to warehouse-native data architectures, and AI becoming the default interface for asking questions about your users.
That evolution opens up real opportunities. PMs and growth leads can now get answers to behavioral questions in minutes rather than days, without writing SQL or waiting on a data analyst. But it also introduces new complexity: what to instrument for AI-native products, how to make sense of agentic usage patterns that don't map onto traditional DAU/MAU logic, and how to pick a platform in a market that’s evolving fast.
We've been tracking this shift across the more than 29,000 companies we work with. Here's what we're seeing in product analytics right now, and what it means for how you build and grow.
What is product analytics?
Product analytics is a discipline and a category of software focused on understanding how users interact with a digital product. It tracks discrete user actions—events—and uses that behavioral data to answer questions about user experience, feature adoption, retention, and conversion.

To understand product analytics, it’s helpful to compare it to a couple of similar disciplines:
- Web analytics measures traffic: how many people came, where they came from, and which pages they visited.
- Business intelligence measures business outcomes: revenue, pipeline, costs.
Product analytics sits in between both, answering why users do what they do inside your product, not just what they did.
Three types of analytics, three different questions
Web analytics, product analytics, and business intelligence each answer a different question. Understanding where they overlap—and where they don’t—is how you build the right stack.
| Web analytics | Product analytics | Business intelligence | |
|---|---|---|---|
| Focus | Traffic and acquisition | User behavior in-product | Business outcomes |
| Primary question | Where did users come from? | What are users doing inside the product? | How is the business performing? |
| Core data | Sessions, pageviews, bounce rate, source/medium | Events, funnels, retention curves, cohort analyses | Revenue, costs, pipeline, LTV, margins |
| Primary users | Marketing teams | Product and growth teams | Finance, operations, and leadership |
| Can’t answer | What users do after they arrive | Where users came from or what revenue looks like | Why user behavior changed |
For example, web analytics can tell you that 1,000 users visited your pricing page last month. A BI platform can tell you that revenue was up 12% last quarter. Product analytics tells you that users who visit the pricing page after completing your core feature tutorial convert at 3.4x the rate of users who visit it directly after signup, and that the tutorial completion rate has been falling for three weeks. That's the insight that changes what you build next.
The foundational analytics model is event-based. An event captures three things: what happened (the action), when it happened (the timestamp), and who did it (the user identifier). From that foundation, product analytics platforms let teams build funnels, retention curves, cohort analyses, and behavioral flows without writing SQL.
Why product analytics matters
The product team’s relationship with analytics used to be mediated by a data team. A PM would submit a ticket, wait a week for a dashboard, and make decisions based on data that was already stale. That model is no longer competitive.
Across 12,000+ companies and 3.7 trillion events tracked in Mixpanel’s 2026 State of Digital Analytics, one finding stands out: The product itself is now the most critical channel for acquisition, engagement, and retention. Companies anchor their growth strategy on in-product behavior like feature adoption and time to value, not on channel-specific models.
This shift matters for how teams use analytics. If the product is the primary growth channel, then understanding user behavior inside the product is the core job of every person working on growth. Retention has become the dominant growth metric: According to Mixpanel’s report, with acquisition costs rising and subscription fatigue tightening consumer spend, retention is now the most dependable driver of sustainable growth.

Product analytics is the infrastructure that makes all of this measurable. It’s how teams answer not just “did we grow?” but “why did we grow, and what should we do next?”
What's changed since 2018
The analytics landscape looks fundamentally different in 2026 than it did when most of the foundational guides on this topic were written (including our own original guide). Two big shifts really capture the evolution we’re seeing across the discipline:
Warehouse-native analytics emerged as a distinct architectural category
The modern data stack (Snowflake, BigQuery, Databricks) changed how companies think about where their data lives. Warehouse-native analytics means querying behavioral data directly from your data warehouse, without duplicating it into a separate analytics system. Both approaches (warehouse-native vs. dedicated analytics platform with warehouse integration) have valid use cases, and understanding the difference matters when evaluating platforms.
AI changed the query interface
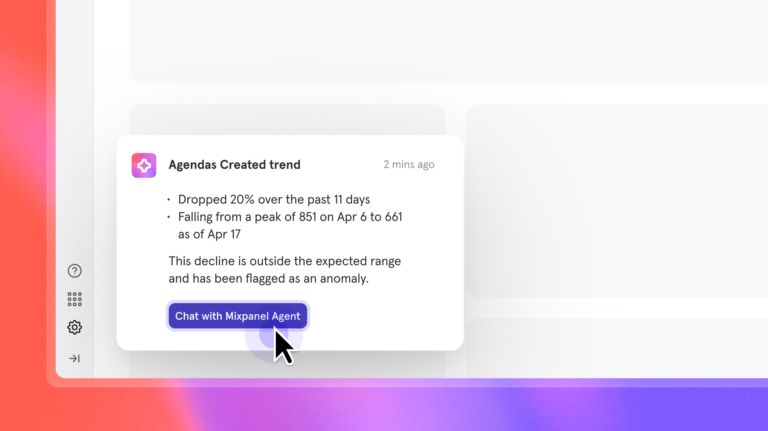
In 2024 and 2025, product analytics platforms shipped natural language query interfaces, automated anomaly detection, and AI-generated insight summaries. The old workflow of “write a query, read a dashboard, notice a trend” is being replaced by a workflow where your analytics platform surfaces anomalies and suggests hypotheses proactively.
How to choose metrics for product analytics
Before you can analyze user behavior, you need to decide what to measure. There’s no shortage of metrics available to a product team; the question is which ones actually connect to outcomes you care about.
Start with your North Star metric (the single number that best captures the value your product delivers to users), then break it down into the component behaviors that drive it. If you’re using Mixpanel, for example, Metric Trees let you connect your North Star to the leading indicators underneath it. So if your North Star is weekly active users, you can see exactly which feature adoption rates, activation milestones, and onboarding completion rates are moving that number in real time. By breaking a North Star metric into its component drivers, teams get clarity on what truly moves the business.
Goals, KPIs, and metrics
Goals, KPIs, and metrics are different. Goals are directional (“grow retention”). KPIs measure progress toward goals (“30-day retention rate”). Metrics are the underlying signals (“n-day retention by cohort,” “feature adoption rate by user segment”). Conflate these, and you risk optimizing for the wrong thing.
Product metrics categories
Engagement
Engagement metrics track how actively users interact with your product over time, measured by the frequency, depth, and quality of key actions. This category of metrics includes daily active users (DAU), weekly active users (WAU), monthly active users (MAU), time in product, and actions per user. Stickiness (the DAU/MAU ratio) is a commonly used composite.
Retention
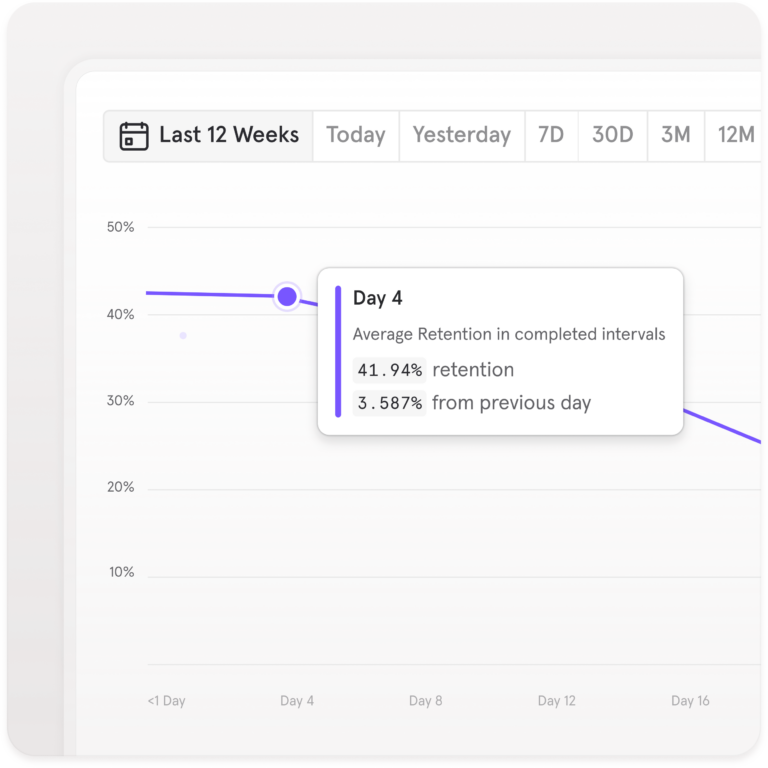
This topline metric measures the percentage of users who return over time. Retention curves, which chart the percentage of users active on day one, seven, 14, and 30, are among the most reliable signals of product-market fit. A curve that flattens above zero means some segment of users has found lasting value. One that continues declining signals the product hasn’t crossed that threshold yet.
The five metric categories every product team tracks
Most product questions map to one of five categories. Start here, then break each down into the specific signals your product demands.
Key metrics
DAU, WAU, MAU, stickiness (DAU/MAU), session depth, actions per user, time in product
Watch forA DAU/MAU ratio above 20% signals strong habitual use. Declining session depth often precedes churn by 4–6 weeks.
Key metrics
N-day retention curves (day 1, 7, 14, 30), cohort retention by signup date or segment, churn rate
Watch forA retention curve that flattens above zero means some users found lasting value. One still falling at day 30 signals product-market fit hasn’t arrived.
Key metrics
Activation rate, time to first key action, onboarding completion rate, aha-moment event rate
Watch forThe activation event varies by product—find it by comparing day-30 retention across cohorts who did vs. didn’t complete specific early actions.
Key metrics
New user volume, DAU/MAU growth rate, acquisition by channel or campaign, viral coefficient
Watch forAcquisition growth without activation improvement means more users seeing the same drop-off. Fix activation first—then scale acquisition.
Key metrics
MRR, ARPU, LTV, conversion to paid, revenue by feature or segment, expansion MRR
Watch forConnect behavioral segments to revenue outcomes. The highest-value users are rarely the most active—they’re the ones whose usage maps directly to your core value prop.
Activation
The percentage of new users who reach the “aha moment”, the specific in-product behavior that predicts long-term retention. Activation rate matters more than acquisition rate in most SaaS contexts, because unactivated users increase costs. The specific activation event is different for every product; finding it requires cohort analyses that identify which early behaviors predict 30- and 90-day retention.
Acquisition
How many new users a product gains over a period of time, typically measured as a percentage change in DAU and MAU. In Mixpanel’s AI industry data, AI product companies saw +27% year-over-year growth in acquisition volume in 2025, the fastest-growing vertical across the platform.
Monetization
Revenue metrics include monthly recurring revenue (MRR), average revenue per user (ARPU), and customer lifetime value (LTV). Product analytics platforms increasingly connect behavioral data directly to revenue outcomes, so you can see which features, flows, and user segments drive the most revenue.
Common metrics for product analytics
Within each category, a handful of metrics are commonly used across most digital products:
- DAU/MAU stickiness, feature adoption rate, and session depth all measure engagement quality.
- Funnel conversion rate (what percentage of users complete a defined sequence of steps) is the core measure for evaluating onboarding, checkout, and any sequential user journey.
- Churn rate and n-day retention curves are the primary signals for whether users are staying.
- Activation rate tells you whether new users are getting to value.
- Time to first key action measures how quickly new users reach the moment that predicts retention.
For teams building AI-powered products, the metrics to add in 2026 include prompts per session and per user, goal achievement rate, and business impact metrics like API call costs.
Which brings us to a bigger topic: how AI is changing product analytics and product management on a macro level.
Product analytics in the AI era
Product analytics processes are changing right now, but the goal of product analytics as a discipline hasn’t altered. Teams still want to understand user behavior, improve retention, and build products people use, but how teams achieve those objectives is different.
We recently wrote about what this looks like in practice—and what we've been building toward—in our Mixpanel AI announcement.
AI products need a different event taxonomy
When a user interacts with an AI feature, the meaningful events are things like “prompt submitted,” “output rated,” “output applied,” and “task completed,” rather than “page view” or “button click”. Teams building AI-native products need to implement these events from day one. Failing to do so means you end up with detailed data on interface interactions and no data on whether the AI actually worked.
How product analytics workflows have changed
AI hasn’t changed what product analytics is for. It has changed almost everything about how teams actually do it.
| Before (2020–2023) | Now (2024–2026) | |
|---|---|---|
| Query method | Manual Write SQL or configure a chart builder; output depends on knowing what to ask |
Natural language Type a question; the platform writes the query and returns an answer |
| Who can analyze | Specialists Data analysts or technically skilled PMs; everyone else files a ticket and waits |
Everyone Any PM, designer, or growth lead can run their own analysis in minutes |
| How insights surface | Reactive Someone runs a query, reads a dashboard, and (hopefully) notices a trend |
Proactive Platform detects anomalies, flags them, and suggests hypotheses before you ask |
| AI product tracking | Page-level Pageviews and clicks; no visibility into whether the AI feature actually worked |
Outcome-level Prompt submitted, output applied, task completed—events that measure AI value directly |
| Time to answer | Hours to days Depends on analyst availability and ticket queue depth |
Minutes Self-serve access means no queue, no wait, no dependency on the data team |
Autonomous agents decouple usage from value
A workflow automation agent might process 500 tasks overnight without a user session, which means that DAU can fall while the actual user value is at an all-time high. This breaks the simple DAU/MAU stickiness interpretation. Teams need to track task recurrence, output quality ratings, and workflow completion rates alongside traditional session metrics. In Mixpanel’s 2026 data, AI product companies tracked 290.8 billion total events in 2025, with engagement patterns varying dramatically by region and product category.
Natural language has replaced SQL as the default query interface
In 2024 and 2025, many product analytics platforms shipped AI co-pilots that let any team member type a question and get an immediate answer. This changes who can do product analytics and how quickly. A PM who previously waited for a data analyst can now run the analysis in minutes.
Analytics platforms now surface insights proactively
In the old workflow, a PM would run a query, read a dashboard, and (hopefully) notice a trend. Now, your AI-enabled platform detects an anomaly, flags it, and suggests a hypothesis. At Mixpanel, we call this the “rise of autonomous analytics”: static dashboards are being replaced by conversational AI co-pilots and agents that plan experiments, reallocate budgets, and automate entire workflows with a human in the loop.
This is why product analytics platforms in 2026 are an active participant in the product development cycle.
How to analyze, understand, and act on product analytics
Collecting data is the starting point. The actual work is turning that data into decisions.
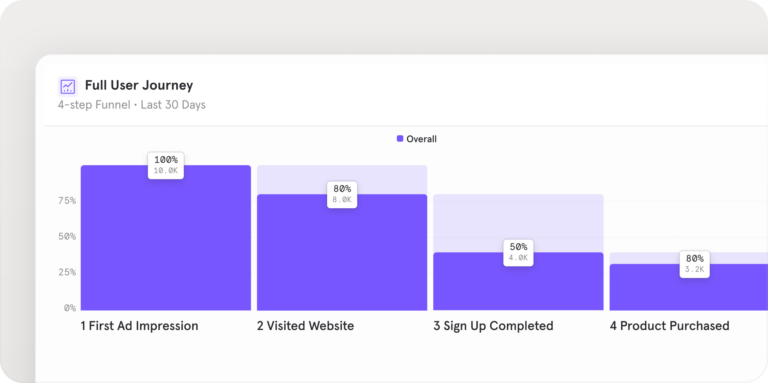
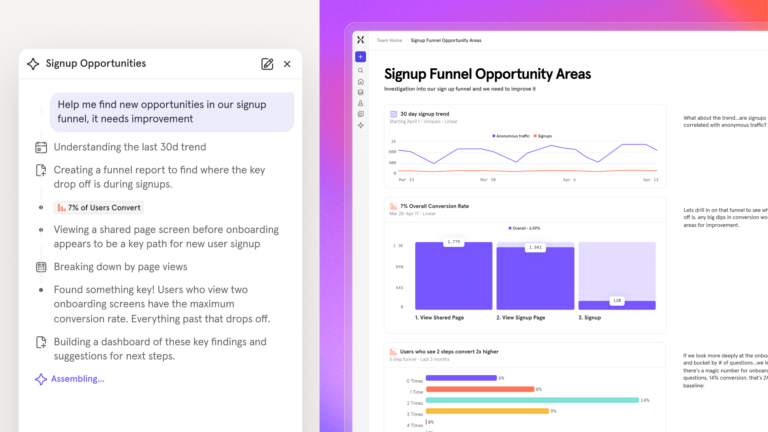
Funnel analysis maps the steps in a user journey and shows where users drop off. If you’re analyzing a sign-up flow, a funnel might show that 80% of users complete step one, 65% complete step two, and 30% complete step three. That last step is where you lose half your potential activations. Funnel analysis tells you where to look; iteration tells you what to do.
Cohort analysis groups users by a shared characteristic—signup date, acquisition channel, plan type—and compares how those groups behave over time. Cohort analysis is how you find the signal behind the noise: if overall retention looks flat but cohorts from a new acquisition channel are retaining at twice the rate of older cohorts, that’s the finding that changes your growth strategy.
Retention analysis tracks the percentage of users who return to a product over time and measures whether product changes move that curve. The most useful framing is to compare retention across cohorts that did vs. did not complete a specific early action, which tells you whether that action is predictive of long-term engagement.
Segmentation splits your users into groups by property or behavior and compares them. Segments let you move from “overall conversion was 12%” to “conversion among Pro plan users who completed onboarding was 47%, while conversion among users who skipped onboarding was 8%.” That’s the finding that tells you what to build or fix first.
How to evaluate a product analytics platform in 2026
The platform selection criteria written five years ago are obsolete: GA4 didn’t exist, warehouse-native analytics wasn’t a concept, and AI features weren’t on the map. The way PMs evaluate a product analytics platform has evolved in tandem. Here’s what we think is important to consider when selecting a digital analytics platform:
1. Self-serve access for non-technical users
In 2026, a good platform lets any PM build a funnel, a cohort, or a retention chart without filing a data team ticket. Before committing to a platform, ask vendors, "Can a PM who doesn’t write SQL answer a specific product question in under five minutes?" That test reveals more than any feature comparison table. This is where dedicated product analytics platforms separate themselves from traditional BI tools.
Six criteria for evaluating a product analytics platform in 2026
The checklist written five years ago is obsolete. Here’s what actually matters when evaluating a platform today.
| Criterion | What to evaluate | The test that reveals it |
|---|---|---|
| 1Self-serve access | Can non-technical team members build funnels, cohorts, and retention charts without writing SQL or filing a ticket? | Ask a PM who doesn’t write SQL to answer a specific product question in under five minutes. Watch what happens. |
| 2Event-level tracking depth | Does the platform support custom event schemas, retroactive analysis, and event-level segmentation—not just page-level tracking? | Send a custom event with five properties and verify you can segment, filter, and funnel on all five within an hour of instrumentation. |
| 3AI-powered querying | Is AI a core capability or a marketing label? Look for anomaly detection that actually works, a natural language interface, and AI-assisted cohort suggestions. | Ask the platform a product-specific question in plain language. If it returns a generic chart rather than an actual answer, the AI is a facade. |
| 4Warehouse integration | Can the platform read from and write to Snowflake, BigQuery, or Databricks without duplicating data? Evaluate warehouse-native querying and reverse ETL support. | Run a query that joins your warehouse data against behavioral events. If it requires an export step, it’s not truly warehouse-native. |
| 5Retention analytics depth | Any platform can show a funnel. The differentiator is cohort retention curves, power user analysis, re-engagement segmentation, and behavioral-to-revenue connections. | Build a retention curve split by users who completed onboarding vs. those who skipped it. The depth of that analysis tells you everything. |
| 6Governance and compliance | Data residency options, consent management integrations, PII masking, audit logs, and HIPAA or SOC 2 compliance if your industry requires it. | Ask specifically: where is data stored, who can see it, and how is deletion handled when a user invokes their GDPR right to erasure? |
2. Event-level tracking depth
GA4 tracks where users go, whereas product analytics tracks what users do—every click, feature interaction, and API call. Evaluate whether a platform supports custom event schemas, retroactive analysis, and event-level segmentation. Auto-capture platforms (which record all events automatically) and schema-first platforms (which require a defined tracking plan) both have valid use cases depending on team priorities.
3. AI-powered insights and querying
Analytics platforms are evolving to surface anomalies automatically, support natural language queries, and generate insight summaries without manual report-building. A key question when evaluating a platform is whether AI is a core capability or just a marketing label. Look for anomaly detection that works, a natural language interface that handles product-specific questions, and AI-assisted cohort suggestions that surface patterns your team didn’t know to look for.
4. Warehouse integration and data stack compatibility
If your team runs Snowflake, BigQuery, or Databricks, your analytics platform needs to read from and write to your warehouse without duplicating data. Evaluate reverse ETL support, warehouse-native querying options, and compatibility with your existing CDP or data pipeline. Rigid CDPs are giving way to flexible, warehouse-native stacks with behavioral analytics at the center, and any platform you evaluate should fit that model.
5. Retention and lifecycle analytics depth
Any platform can show you a funnel. The real differentiator is the depth of retention and lifecycle analysis: cohort retention curves, power user analysis, re-engagement segmentation, and the ability to connect engagement signals to revenue outcomes. This is where product analytics platforms earn their keep over general-purpose BI tools; this differentiator matters more, not less, as retention replaces acquisition as the dominant growth metric.
6. Governance, privacy, and compliance
GDPR, CCPA, and an expanding set of regional privacy regulations have made data governance a buying criterion, not a post-purchase concern. Evaluate data residency options, consent management integrations, PII masking, audit logs, and HIPAA or SOC 2 compliance if your industry requires it.
Product analytics in practice: An example
When Lemonade entered the insurance market, they built their entire growth strategy around product data from day one. To do so, they used Mixpanel to track events and gather behavioral insights from inception, not as a bolt-on after product-market fit. In one year, they secured over 70,000 insurance policies for more than 100,000 policyholders. The analytical foundation was in place before the growth, which is why the growth was sustainable.
We’ve had Mixpanel implemented since Day 0—even before our public launch—to test that our infrastructure was working.”
Lemonade also identified that friction points in their policy submission process were creating technical and UX problems. Fixing them produced a 50% increase in overall conversion for extra coverage. The insight came from product analytics; the improvement came from acting on it.
For teams building AI-powered products, the current version of this story looks a bit different. Consider a B2B SaaS product that ships an “ask your data” AI co-pilot. Early adoption looks strong, and then the team realizes they can’t actually tell whether users are getting value from it. Click data shows that users opened the co-pilot, but nothing about what happened next. Tracking prompts sent per session, prompt-to-action rate, and feature return rate at seven and 30 days gives the team the signals they need to know whether the AI feature is working, or whether users tried it once and moved on.
Getting started with Mixpanel
Mixpanel is built for exactly the version of product analytics this moment demands: event-level behavioral data, self-serve access for any team member, and the depth to connect user actions to business outcomes without a data team in the loop. If the product is your primary growth channel—and for most digital businesses, it is—Mixpanel gives your team the infrastructure to understand what's actually happening inside it.
Mixpanel AI is a large part of how we're helping teams keep pace with the speed of modern product development. It watches your key metrics continuously, surfaces insights before you ask, and answers product questions in plain language across Slack, Cursor, Claude, and wherever else your team works—so the bottleneck stays where it belongs, not in the analytics stack.
The teams that win in this next era won't be the ones who shipped the most. They'll be the ones who learned the fastest.