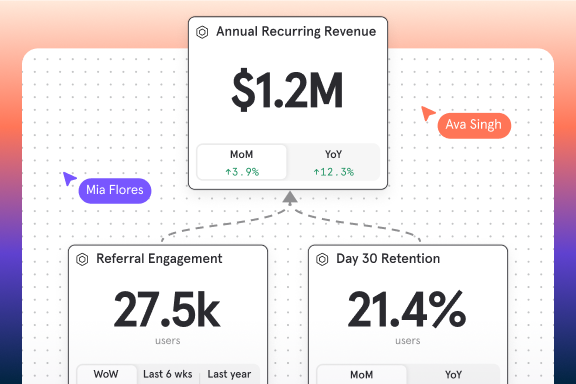
KKday makes user behaviour data accessible to employees, building a culture of analytics to drive better user experiences.
Company
Founded in 2014, KKday is one of Asia’s leading innovative travel e-commerce platforms that seeks to offer its users the world’s most unique and local travel experiences. Headquartered in Taiwan, they have served over 1 million travelers in more than 500 cities. The company has offices across Asia, including Hong Kong, Indonesia, Japan, Korea, Singapore, and Thailand.
Challenges
KKday had been operating their websites since launch in 2014, but adapted to increased mobile traffic by launching a mobile website and app in 2017. With those launches, the product team found that they needed a way to track user behavior not just on each of their different digital assets, but also to connect the dots between the users’ behavior across all three.
“Imagine if a user browses our website in the day using their work computer, then goes home at night to make a purchase using our mobile site, and then downloads our app to check their order and recommend it to their friends. There are many user journeys of this kind, and it is a pity if we cannot track this.” said Sherry Shih, Product Manager at KKday.
Unfortunately, their existing tools could not support this vision, and this became more urgent as more users started to leverage their new mobile website and app.
Identifying the right product analytics platform
This led the KKday product team to search for a new product analytics partner who could support their user-focused vision. In the course of their research, the team was impressed by Mixpanel’s powerful analytics capabilities across different platforms.
Sherry explains, “We found that we can analyze user behaviors by embedding events and attributes, and then group users into cohorts based on their behaviors. This would allow us to run targeted marketing campaigns on these cohorts to help us progress towards our revenue goals.”
We used to think that our time to conversion was between one to three days but after looking at the data in Mixpanel, we realized that 85% of the time, people were completing their booking process within just 50 minutes. This informed us to better design our user engagement to fit within this time window, instead of optimizing it for one to three days.Sherry Shih Product Manager, KKday
Results
Big wins, early on
It wasn’t long before the improved visibility reaped benefits for KKday. One of the first things that they noticed through Mixpanel’s Insights report was that 80% of the keywords searched by their users were city names. To help users find what they were looking for in a much shorter time, the KKday product team built a new feature in their search box. The 20 most popular cities now show up as soon as users click in the search box.

The team also looked at their conversion funnels and successfully identified which functions on the checkout page were causing the most drop-off. This enabled them to make positive changes to the checkout experience and double their conversion rates to drive increased revenues.
“Before Mixpanel, we didn’t have the complete map of our user journey. Now that we have full visibility, we can segment our users according to their behavior and better target them. We used to think that our time to conversion was between one to three days but after looking at the data in Mixpanel, we realized that 85% of the time, people were completing their booking process within just 50 minutes. This informed us to better design our user engagement to fit within this time window, instead of optimizing it for one to three days,” said Sherry.
Hitting the right notes with personalization
KKday continued to dig into the data and experiment on their website to optimize the sorting/display of their products. By looking at the Insights report in Mixpanel, the team realized that they could show more relevant products by sorting on a combination of the number of times a product was sold and the number of times they were viewed. This led to a 7.7% increase in click rates compared to sorting just on sales volume.
Mixpanel also helped to make it easy for KKday to understand the impact of their machine learning efforts. The team implemented machine learning to help personalize the product sorting for each user. By comparing the results with and without the personalization, they could see that personalization resulted in 4.4% more conversions via the Funnels report in Mixpanel. This helped them to decide to continue investing resources into machine learning to improve their customers’ experience and the performance of the KKday platforms.
Building alignment and a data-driven culture
One of the key goals for KKday was to build alignment across departments and to help foster a company-wide culture to be focused on their users. Here too, the team benefitted from their use of Mixpanel.
While different departments used to look at Google Analytics and other business intelligence tools separately, KKday now uses Mixpanel to serve the same view of user behavior insights and key metrics to help the entire company to understand their users in the same way even if the different departments may use the insights differently.
“Now our entire company understands user behavior and values data analysis. Before making strategies, we first come up with hypotheses for our primary metrics. Being able to track our metrics helps us to determine which projects are important and reach our goals faster. This is important for us because time and resources are valuable,” shared Mike Chen, Chief Product Officer at KKday.
Now our entire company understands user behavior and values data analysis. Before making strategies, we first come up with hypotheses for our primary metrics. Being able to track our metrics helps us to determine which projects are important and reach our goals faster. This is important for us because time and resources are valuable.Mike Chen Chief Product Officer, KKday

