


More than clicks and views: How digital media companies can drive business growth with product analytics

For digital media companies, understanding which content gets the most views and plays is just the first step.
Product teams at the best digital media companies and products understand not only what content their users consume, but also why and how. Netflix, for example, is famous for the amount of data it collects and, more importantly, how it leverages this data to provide custom movie and TV show recommendations to users.
Whether your platform serves up video, audio, or written content, analytics are the key to improving everything from discoverability to driving revenue. Keep reading to learn how to leverage product and marketing analytics tools to achieve these goals.
Four ways to grow your audience and business using product analytics
1. Understand which areas are driving engagement
Tracking metrics such as page views, time-on-page, and bounce rates, can help you identify high-performing content—but knowing which content performs well isn’t enough.
Discoverability is becoming an increasingly important differentiator when consumers are choosing media platforms. In 2023, 61% of Hub Entertainment’s annual Conquering Content study respondents said they’re more likely to choose a TV source that makes it easier to find new shows—an 8% increase from 2022.
In other words, the easier you make it for your audience to find the content they want, the more likely you are to engage and retain them.
A good product analytics platform can help you find out if your most engaged audiences come from a recommendation widget or a search, if they’re discovering content by clicking through genre or category pages, and so on.
In Mixpanel, you can do this using the Insights report:
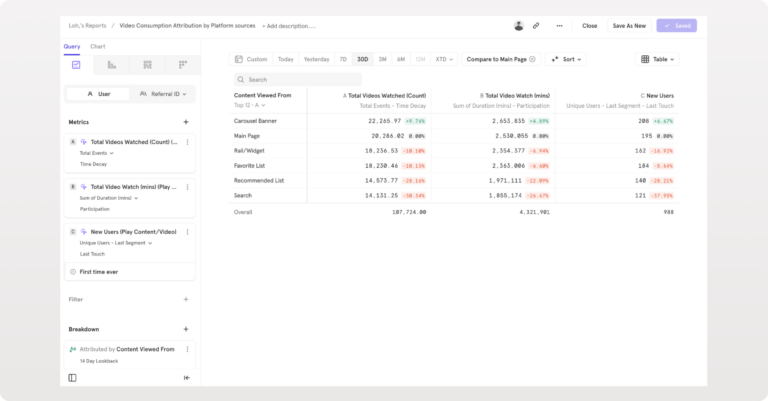
This analysis of both the breadth and depth of engagement is useful because it empowers PMs to double down on the right features and create the smoothest discovery experience possible.
2. Dig into consumer segments and cohorts
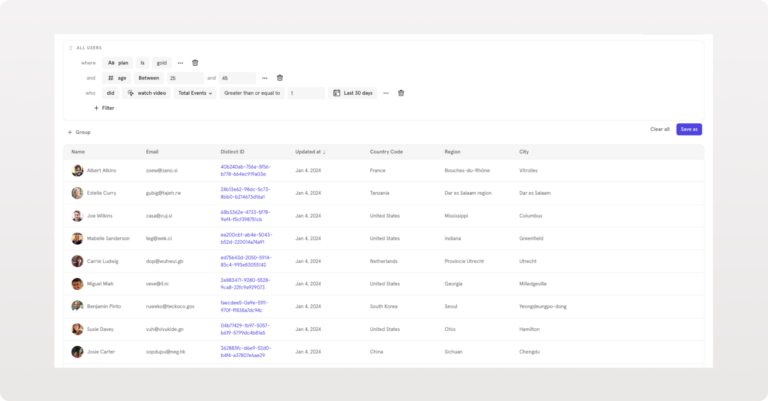
Product analytics also makes it possible to do segmentation and cohort analysis, which will help you understand the diverse sub-groups and behaviors within your audience.
For example, you might find that a demographic of a certain age or gender has an affinity for a certain genre. This could help you build a tailored and more engaging “cold start” experience in the platform for new users you don’t have any existing usage data for. Some companies that use Mixpanel have even found their users in regions with poor internet connection tend to respond more to static thumbnail previews compared to five-second preview clips. Insights like this can be uncovered with Mixpanel's Find Interesting Segment feature, which can easily identify segments that convert higher or lower than average and are therefore statistically significant.
In Mixpanel, you can segment users based on criteria like demographics and behavior—like users who watched more than 10 videos in the last seven days:
Segmentation was a key pillar of Ticketmaster’s strategy when it rolled out a B2B application called FanBuilder, which was built to empower its clients to create highly targeted campaigns for specific audiences.
With such a large global portfolio of venues and promoters, Ticketmaster and its FanBuilder team needed a much deeper understanding of the many subgroups within its different audiences. So, they used Mixpanels’ Insights, Funnels, and Retention reports to better understand engagement across different segments and retain and grow their most profitable venues, artists, and promoters.
Segment analysis also supports another key revenue driver: advertising. Advertisers want to be able to target users with very specific demographics or interests—and are willing to pay for this level of granularity.
What’s unique about Mixpanel is it lets you collect behavioral data alongside all your own first-party data. This combination of data lets you create extremely targeted cohorts, which you can then use to pitch to advertisers and increase ad revenue.
3. Prioritize investments more effectively based on time to discovery
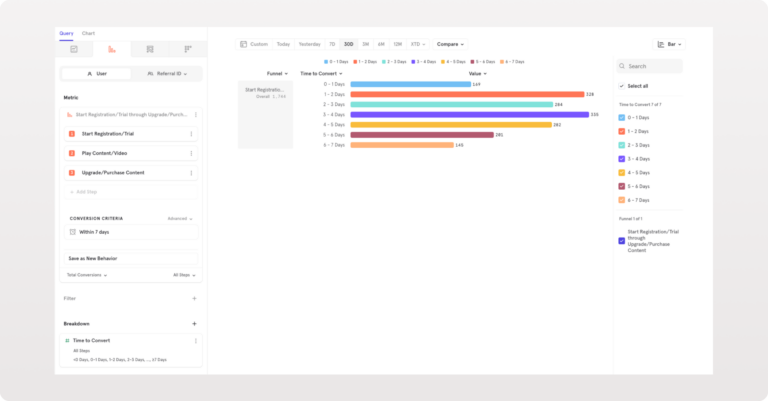
Time to discovery is a critical metric that reflects how quickly your audience finds and consumes your content. It’s heavily influenced by the source your audience comes through, such as organic search or paid advertising.
For example, a direct search might have a shorter time to discovery compared to the recommended section (or “rail”) on the home page because the user knows what they’re looking for. By measuring and understanding the time to discovery for each source, you can optimize your content distribution strategy and user experience.
Let’s say a prospective user searches for a certain show and sees that the platform has it. You could throw in an early bird or first-time customer discount as an incentive to nudge them over the finish line and sign up for a subscription.
On the other hand, if we know that a user is just browsing and clicking through different pieces of content, it’s probably more beneficial to let them explore on their own with a free trial period because they’re in more of an exploratory phase.
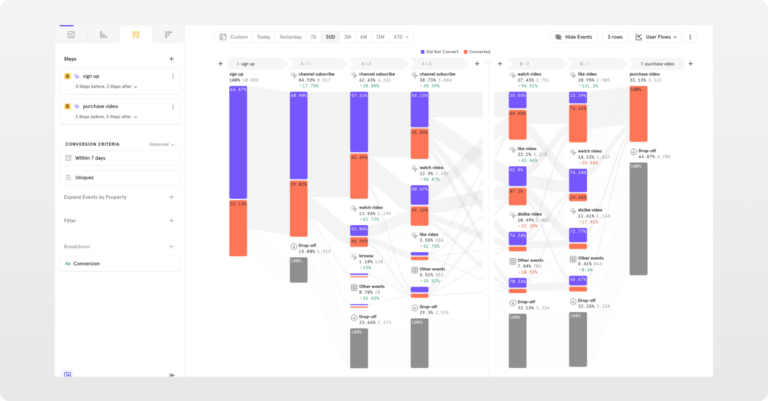
To track all of this and uncover ways to remove friction from the user experience, you’d need a product analytics report that lets you break things down by source. The Flows report in Mixpanel does this, letting you see everything from drop-off points in the user journey to the different paths that users take as they move toward making a purchase:
4. Experiment with A/B tests
A/B testing is a powerful tool for any product and data analytics team. And while there are many A/B testing solutions, few have the advanced data analysis features that product analytics platforms have.
You can test a huge variety of elements to improve a digital media platform’s performance, from copy and images to content placement, and subscription or free trial flows. For example, you could experiment with different video thumbnails to determine which leads to higher play rates.
Joyn, a fast-growing entertainment streaming platform, uses Mixpanel’s dashboards and A/B testing features to answer questions like, “I put this show in this hero position on the homepage between 7 and 8pm—did this lead to traffic converting?”
The insights gained from these A/B tests can inform content creation, placement, and distribution strategies, ensuring that you consistently deliver content that resonates with your audience.
Future-proof your media product strategy
Product and marketing analytics are indispensable for driving both content consumption and advertising revenue. By understanding which areas drive engagement, measuring time to discovery, experimenting with A/B tests, and digging into segments and cohorts, media companies can optimize their content strategies and attract advertisers.
As the digital media landscape continues to evolve, the ability to harness data-driven insights will be key for companies looking to sustain audience retention and revenue growth over the long term.
Gain insights beyond just content consumption patterns with Mixpanel’s powerful self-serve analytics. Try it for free.