


Mixpanel Alerts, upgraded: More control, more visibility, more flexibility

The most valuable thing your data can do is come to you.
Not wait for you to open a dashboard. Not surface an insight only when you remember to go looking. Instead, done well, alerts come to you with the right signal, at the right moment, before you knew you needed it.
Done well, that can mean the difference between catching a problem before it becomes a crisis—when you have an opportunity to act—versus one you discover after it's passed.
That’s why today we're shipping a major set of improvements that give teams significantly more control over how alerts work in Mixpanel. Let’s take a closer look.
Full visibility into how your alerts are working
The moment after an alert fires is when context matters most: Is this new, is it recurring, and did anything change recently that might explain it?
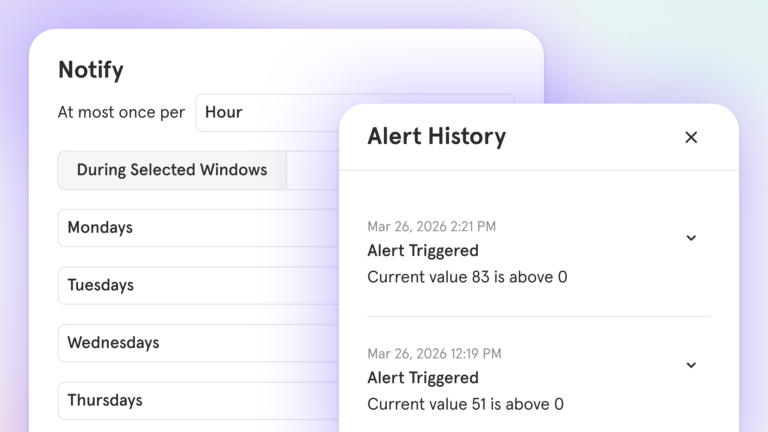
Now, every time an alert triggers, or is changed, it’s logged in a dedicated alerts history with the exact metric value at that moment. And, when an alert fires, you can immediately dig into whether it's a pattern or a one-off and audit how it's behaved over time, right inside Mixpanel.
Plus, when an alert breaks because an underlying report was changed, Mixpanel notifies the owner immediately, in the UI and via email or Slack, rather than going dark.
The enhanced alerts management hub brings it all together: a dedicated Alerts tab in Project Settings showing the history for each alert, status, last triggered time, trigger count, and sync health for every alert in your project.
More precision on when alerts fire
Metrics don't behave the same way all day or all week: Traffic drops at night, conversion dips on weekends. If your thresholds don't account for those patterns, you get noise, and noise leads to alerts that get skimmed instead of acted on.
Notification windows let you define exactly when an alert should evaluate: specific days of the week, time-of-day windows, or multiple schedules with different thresholds for each. The alert fires when something is genuinely unexpected, not when behavior follows its normal pattern.
Before enabling any alert, you can also run a retroactive test over any historical window to see how many times it would have fired and at what values. Calibrate first to avoid accidental spamming, then go live.
More reliable anomaly detection (powered by a new forecasting model)
Anomaly detection is only as good as the forecast behind it. To make anomaly alerts more dependable day-to-day, we’ve upgraded the forecasting model that powers them.
We’re migrating from Prophet (an open source model from Meta) to TimesFM V2 (an open source model from Google). TimesFM V2 is LLM-based and has shown significantly better forecasting accuracy on real Mixpanel time series.
- TLDR: Anomaly alerts should be much more reliable now.
- In testing across 3,000 real-world time series, we saw 85% lower mean MAPE and 54% lower RMSE versus Prophet.
Alerts to the right place, with the right context
Alert notifications now include a chart of the metric trend at the moment the alert triggered, not just the raw value. You get the context you need to decide whether to act, before you've even opened the product.
For teams who need alerts beyond email and Slack, webhook support lets you route to any HTTP endpoint in your stack: incident management platforms, workflow tools like Zapier or Make, custom internal dashboards, or anywhere your team is already responding.
Built for proactive action
Together, these aren't just feature additions. They add up to a more complete system for monitoring what matters.
They’re also a foundation for what comes next: alerts that don't just notify you when something crosses a threshold, but feed into proactive, AI-driven analysis of what's happening across your data.
Alerts Improvements are available now for all Mixpanel customers. Explore the docs.