

Don’t just measure new vs. returning users—get the context behind the metrics

Whether you’re measuring performance for a website or an app, you’ll have two main audiences to keep in mind: new and returning users or visitors.
Each segment is valuable in its own way—new users are important for acquisition and growing the business, while returning users are key to retaining and compounding revenue. Although growth is always top of mind for executive and leadership teams, the benefits of retention sometimes get overlooked.
But with increasing customer acquisition costs (for example, the ecommerce industry experienced a 222% increase from $9 in 2013 to $29 in 2022), and the significantly lower cost of retaining customers (anywhere from three to six times less depending on your industry), it doesn’t make sense to ignore returning users.
As Marketing Operations Manager at Mixpanel, I’m always looking at trends and patterns in our users’ behavior and leveraging these insights to drive more effective marketing campaigns. I’ll share some tips below for tracking new and returning users, what traditional marketing analytics data won’t tell you, and how to use Mixpanel to get more context behind user and visitor numbers.
New vs. returning users: What’s the difference?
New users and returning users are two distinct segments that you can measure in web and product analytics to better understand where your revenue is coming from. There are different methods for identifying whether a user is new or returning, including creating anonymized device IDs and digital cookies.
New users are visitors who are visiting your app for the first time. They’re crucial for measuring brand awareness and growing your customer base.
In contrast, returning users have visited your app before and are more likely to engage, convert, and make repeat purchases. Tracking both new and returning users gives you valuable insights into the effectiveness of your marketing programs and customer retention strategies.
New and returning “visitors” are similar, only you’re measuring visitors to a website instead of users fully engaging with an app or digital product.
New vs. returning users (and other metrics)
Google Analytics defines "new users" as people who have never visited your website or app before in a specified date range. "Returning users" is the number of people who have visited your website or app before in that specified date range.
What gets tricky here is that Google isn’t always able to tell new and returning users apart. To get a more accurate read, you’d need to use different analytics tools that can do this type of traffic analysis more effectively.
For example, if I viewed Mixpanel.com on my desktop and then later on my cell phone, those would show up as two different new users in Google. But Mixpanel can identify that it’s actually a single user using two devices thanks to our identity management, which also works retroactively.
New vs. returning users: What’s the best ratio to have?
There’s no one-size-fits-all answer to the ideal ratio of new to returning users because it varies depending on factors like your industry, ACV (average contract value), and business model. Because of this, we’d argue that it’s actually not helpful to try to hit an arbitrary ratio.
Instead, it’s more beneficial—and practical—to focus on improving your new and returning users metrics based on your business goals. For example, if you’re selling to enterprise companies with a small total addressable market (TAM), you may have to focus more on upsells and cross-sells, which means you might want a higher proportion of returning users.
But new and returning user (and new and returning visitor) numbers can’t tell the whole story on their own—ideally, you’ll have a constellation of metrics that provide valuable context for why and how you’re attracting users. Here are a few examples.
Important metrics to track for new users
First-touch conversion
If your marketing messages, website copy, and conversion funnels are on point, users are more likely to convert on their first visit. Tracking this metric will tell you if changes have a positive or negative impact on new user conversions.
New users’ actions before converting
Knowing which traffic channels drive the most new users that end up converting can help you optimize your channel mix to capture the attention of more high-quality visitors. It also tells you what interests new users the most and potential ways to enhance user experience.
One of the pitfalls to avoid when tracking new and returning users is forgetting to connect those numbers to a business outcome. You know that people are interested in a page or feature, but is anyone actually signing up or converting?
Important metrics to track for returning users
Retention rate
Once you gain a new user, the next task is keeping them. How often a user returns speaks to your retention rate.
Subsequent visit conversion rate
Many return users didn’t convert on their first or even second visit. Tracking the behavior of returning visitors provides insight into why users convert on subsequent visits and how to increase and accelerate that conversion rate.
User engagement
When measuring user engagement, you can look at metrics like pages per session, average session duration, and interactions with site features. Returning users are typically more engaged, but unless you isolate returning user metrics, you won’t know how engaged they are and what type of content is holding their interest.
Customer lifetime value (CLV)
CLV estimates the total revenue you can expect from a returning user over their entire relationship with your brand. This metric helps you understand the long-term value of nurturing returning users and also whether your CAC (cost per acquisition) is worth it. For example, a CAC of $1,500 might seem high, but if your average CLV is $5,000, then that high cost wouldn’t seem so high anymore.
Important metrics to track for both new and returning users
Time on page/screen
This is the amount of time that users spend on your website and provides insight into how engaging and relevant your content is.
Bounce rate
This is the percentage of users who leave your site after viewing only one page, or after a very short period of time. It tells you how well your landing pages are capturing customers’ interest and encouraging them to explore further.
The bounce rate for new users is a reflection of your website or app’s first impression. If the bounce rate is high, there’s an issue that needs to be addressed. Either the marketing message is off, users aren’t sure what to do once they hit the landing page, you’re targeting the wrong market, or users don’t see the value of the product or service.
Top pages / popular topics
This data is extremely useful because it tells you the "how"—how are you attracting these new and returning users? When you look at the list of your top 10 pages for both sets of users, for example, you may notice that new and returning users gravitate toward different topics.
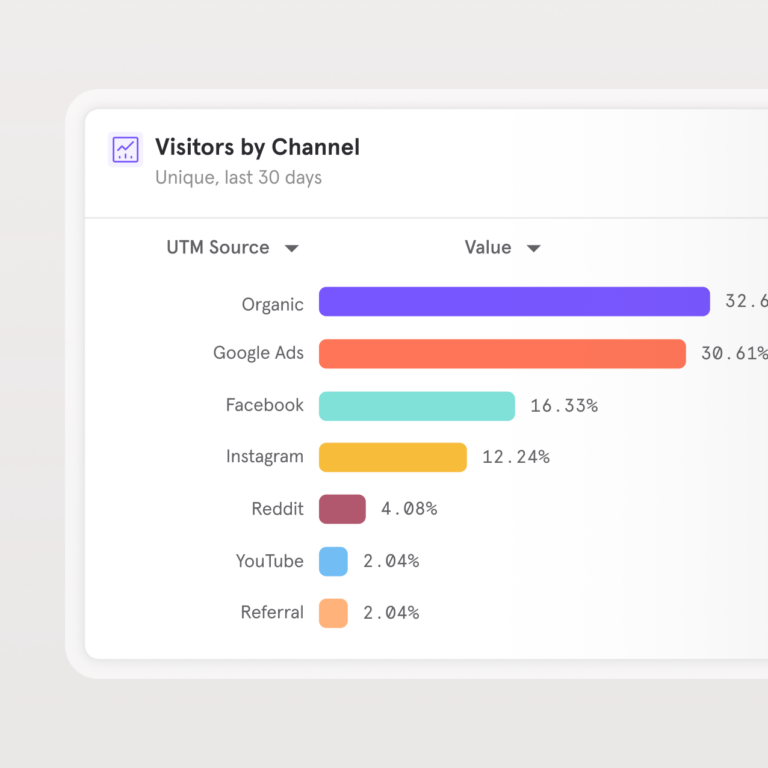
Top channels
You can also track the channels that users are coming from, such as search engines, social media, and referrals. This will help you understand which ones are most effective in driving traffic, so you can invest more in those channels.
What’s really important here is separating paid from organic search when you’re looking at traffic-driving channels. Putting paid spend behind a page is going to lead to a much higher number of new users than just letting people find it organically, and a lot of people forget to split those out.
This is actually quite simple to do in Mixpanel—we can break out paid per click (PPC), organic, display—it’s a great marketing analytics feature.
How to track new vs. returning users in Mixpanel
You can dig into the data of new users with Mixpanel in an Insights report. This is where you’ll be able to track new users who have completed different behaviors for the first time, such as viewing a page on a website or completing a purchase.
For example, to compare how active new users are on your blog, you include two “Page view” events and filter with a First Time Users cohort you've created for one of them.

This will give you two line charts showing your total users vs. new users. In the example below, average events per session is being visualized.
To look at returning users, filter by the custom Returning Users cohort instead of First Time Users cohort.
What traditional marketing analytics tools can’t help you with
While there are many marketing analytics tools out there, traditional tools have a key weakness: they miss out on the “why” of your user data.
They may tell you the number of new vs. returning users, but they won’t be able to provide essential context such as the reasons behind user retention or which specific content is driving those two user segments or cohorts.
To understand the “why,” you need a contextual analytics solution like Mixpanel that gives you rich context about your users.
One of the great things about Mixpanel is the user enrichment—with returning users, we can do things like filter out whether they’re on a free or paid plan and look back to when they first visited the website. This can help us figure out, for instance, that certain content might resonate with free plan users but not paid account users.
How the Mixpanel team use Mixpanel to add context to new vs. returning user data
User enrichment provides a lot of helpful insight about both customers and prospective customers — which helps Marketing teams find ways to nudge them through the customer journey toward a purchase or repeat purchase.
Say we're doing a big push to drive awareness of a new feature amongst our Enterprise target account list and current Enterprise customers. We can use Mixpanel to see if we're generating a lot of new and returning users in our target audience from awareness and education campaigns, break out mobile vs. desktop, and see which channels they’re coming in through.
And whereas Google Analytics 4 has the power to define custom user properties, Mixpanel goes a step further. With Group Analytics, you can analyze web behaviors at a custom group level, such as account, device, or any other way you'd like to group your users.
Group analytics is great for B2B marketers because it offers the ability to enrich their user profiles with group properties. You can enrich according to the industry in which a user's employer works, or analyze a company that's researching your product by individual user actions. Good luck trying to do that in GA4!
Understand the “why” and “how” behind your new and returning users
Tracking and analyzing the behavior of new vs. returning users can give you valuable information about how many customers and prospects are interacting with your site or app—it’s a vital metric to keep an eye on.
But there is much more contextual information that will help you pull the right levers to influence those user actions, whether you want to attract fresh traffic or retain customers (or both).
Try Mixpanel for free to see how you can go beyond just “new vs. returning users.”