Product usage analytics
What is product usage analytics?
Product usage analytics is the process of analyzing in-product data to understand how users interact with your product, and why they do the specific things they do. It differs from things like traditional surveys and customer interviews by helping you find out what your users really do, based on user-level data in a digital product—not just what they say they do—so product teams can prioritize development efforts with speed and confidence.
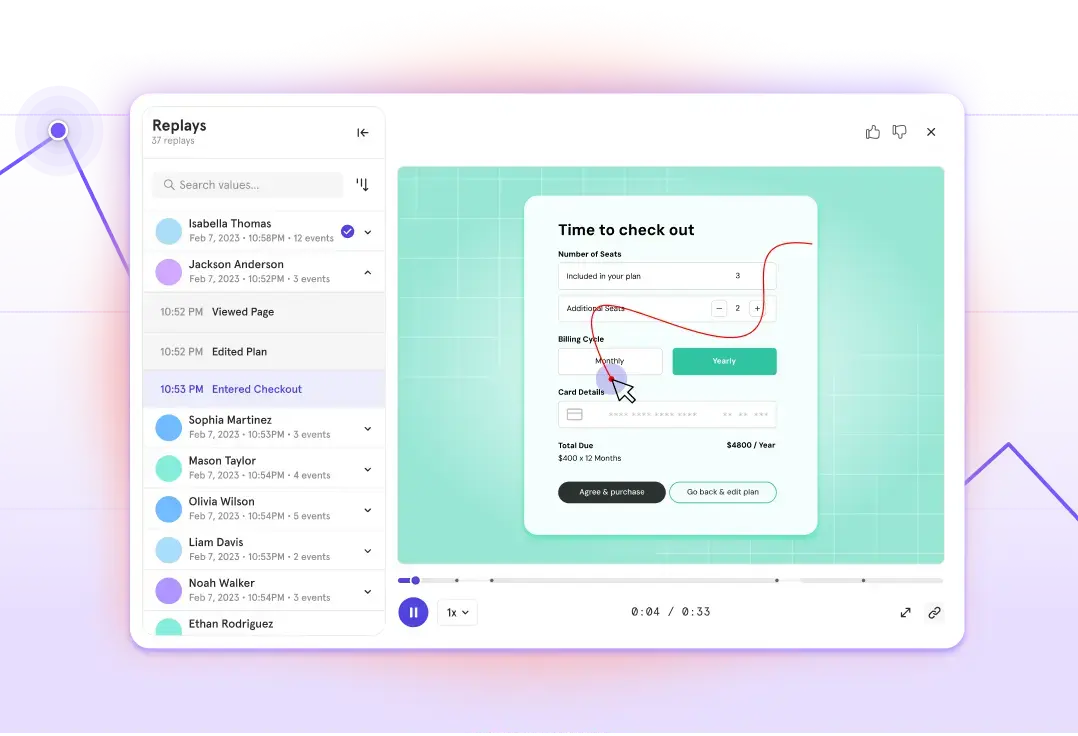
Product usage analytics is best conducted with dedicated product analytics tools due to their ability to track and record every meaningful in-product user interaction, as well as their self-serve UX which encourages unstructured exploratory analysis.
Why do I need product usage analytics?
More often than not, product teams are limited to surface level data which doesn’t let them understand how their product gets used. Furthermore, product teams are quite often constrained in analysis due to bottlenecks with analytics teams. But, as we know, the most innovative companies turn to data to get a clear view on their users so they can build better experiences.
Product usage analytics solves both these problems by helping product teams track important product usage data, and then analyze it themselves so they can learn what works (and what doesn’t) directly from user data, and stay on top of important product usage metrics like stickiness and activation. Product usage analytics can help you figure out:
- Which features are most popular.
- Overall product performance.
- How engaged users are.
- The type of users that use the product most heavily/often.
- Whether users find value in a product/service/plan.
- What friction points or issues users are running into.
- The stickiness of the product.
- Effectiveness of engagement strategies and campaigns.
- What a user workflow looks like.
- How adoption or retention vary across user segments.
- When and how you need to communicate with your users.
- The results of A/B testing on user behavior.
This is just a small subset of what analyzing product usage data can reveal, which is why this type of analysis is considered to be an integral part of product development.
How is it different from other forms of analysis?
Product usage analytics is just one part of understanding your entire user journey. Most companies have multiple analytics tools in their tech stack, and marketing analytics tools like Google Analytics and business intelligence tools like Tableau are most common.
But, as the number of digital products and services has grown over the last few years, so has the popularity of product analytics tools that enable product usage analysis‚ and for good reason. While each tool has its merits, neither tool is meant to be used in isolation.
Product usage analytics vs. marketing analytics
Marketing analytics is very helpful in understanding where your users are coming from, and is often used by marketers to report on metrics related to acquisition and attribution with tools like Google Analytics.
Though marketing analytics is incredibly helpful, it is often used by teams that have fundamentally different objectives from product teams. Product usage analytics, on the other hand, leverages real-time data on product usage and is used by product teams to analyze and understand specific actions users take in a digital product and ultimately to report on metrics related to adoption, engagement, and retention.
Both tools are important in their own right, and many use both to understand the full user journey.
Product usage analytics vs. business intelligence
Business intelligence is helpful for analyzing and visualizing important data from all parts of your business, whether that’s sales or finance, and can be incredibly powerful for reports and visualizations across many datasets. Popular tools like Tableau and Looker are used to inform business strategy and tactics, and report on KPIs like ARR and revenue churn. However, this requires technical expertise and can be a blocker to getting the real-time data needed to take meaningful action, fast.
Product usage analytics, on the other hand, is meant for exploratory analysis of product data to understand things like user funnels, flows, and retention (to name a few). Product professionals as well as data analysts can dig into user trends and self-serve answers to their questions without the need for a data expert.
As with marketing analytics, product analytics and business intelligence have unique use cases, but can be used together to learn more about your business and product health.
Making the most of product usage data
The key to making product usage analytics work for you isn’t just obtaining product usage data. Every action that a user takes can be logged by software, but that doesn’t make it fully usable. The data then has to be extracted and loaded into a database from where it can be analyzed to look for trends and variations over time.
But parsing out and interpreting product usage data isn’t easy if it’s just a bunch of numbers in a table. That’s where product analytics platforms, like Mixpanel, come into play. These allow you to clearly visualize this data using charts and graphs that are easy to create and read without needing specialized training or data expertise.
Product usage analytics is but one tool in a product manager’s toolbox, but it’s arguably the best one. Product data doesn’t lie, and can help you make informed product decisions based on facts, not conjecture. Product usage analytics allows you to use this actionable information to improve the quality of your product as well as the customer experience, and sets you up for true product innovation.
Interested in finding out how Mixpanel can help you make the most of your product usage data? Visit our website to see what we have to offer!


