


What is marketing analytics?

Marketing analytics is the use of software and processes to collect the data needed to measure, test, and improve marketing performance. Effective marketing analytics helps marketers analyze and report on what has happened and use those insights to help them influence what will happen.
Marketing is the intersection of creativity and data. The best marketers create innovative, exciting campaigns that grab people’s attention and generate buzz.
But none of that matters if those campaigns don’t help your company achieve its goals. And the only way to know the impact of your efforts is to measure them, continuously, in real time.
And to do that, you need marketing analytics.
Here, you’ll find a deep dive into marketing analytics: the basics, the benefits, and the challenges, plus tips on how to set up marketing analytics and choose the right solution for your business.
Let’s jump in.
What is marketing analytics?
Every marketing effort has a goal, whether that’s more website views, increasing conversions, or improving ROAS (return on ad spend). Marketing analytics is the combination of software and processes you put in place to collect the data that allows you to measure, test, and improve your marketing performance to meet those goals.
A piece of the larger analytics puzzle
Of course, meeting marketing goals is important, but it’s only one part of the bigger picture: Most modern marketers tie their metrics to company goals and North Star metrics and work in tandem with other teams on company-wide initiatives like increasing revenue and market share.
Focusing on ToFU (top of funnel) metrics is easy, but they don't pay the bills. For marketing analytics to be worthwhile, it needs to impact revenue outcomes. The only way marketing analytics can provide marketers with that power is when it combines not just ToFU metrics, but also product and revenue metrics into one cohesive practice.
Otherwise, different teams are working in silos towards different goals instead of working together.
Read Mixpanel’s take on modern marketing analytics and how the discipline relates to the user journey.
Benefits of marketing analytics
Without marketing analytics, marketers are flying blind. What’s the point of launching a campaign if you have no way to track its cost and impact? Even the smallest technology company will use some kind of marketing analytics to track their results—social media platforms have built-in analytics and dashboards, for example.
But those tools are tied to a single source, like Facebook or Twitter. It’s not advantageous for those companies to give you access to metrics from different sources in one place; they want to keep you on their platform for as long as possible.
Good marketing analytics will tie together data from all of your different sources, bringing everything from paid campaigns to email, social, and website visits under a single umbrella so that you can attribute and track different touchpoints to get a complete picture of the full user journey.
The right marketing analytics will help you understand customer behavior, refine marketing strategies, identify gaps, and understand where to allocate resources to increase ROI. Most importantly, you should be able to track the impacts of these things in near real-time.
Marketing analytics in practice: Faster insights and daily campaign monitoring
TaskRabbit was using a manual spreadsheet and dashboard system to track and measure their marketing performance. The system was slow, and they often couldn’t analyze the results of a campaign until weeks had passed.
As TaskRabbit Staff Product Manager, Nikhita Sagar, explains:
“With the old way, we’d have a marketing campaign running and it would take three or four weeks to get insights on performance,” says Sagar. “The campaign had to run for a month to even collect enough data, then it took another month to set up an analytics dashboard for it. By then, we were in a new season with a new audience—even if we did finally get learnings, they were relatively useless.”
Today, Sagar and her team use marketing analytics to monitor their campaigns daily. “In Mixpanel, I can see right away if something goes wrong, like if the number of jobs suddenly drops below our daily average. It’s instant.”
Challenges of marketing analytics
Even in data-informed companies, marketers often face challenges when trying to leverage marketing analytics.
For starters, data comes from different sources, and other teams often have the data that marketers need. Each team has its own objectives and priorities, and making that data accessible to marketers who need it is rarely at the top of their list.
Once marketers get access to data, they need the capabilities to analyze it. Collating a mountain of data from disparate tools that they can’t clean up or integrate is a nightmare. Without cross-channel data integration, the data will remain siloed and ultimately useless.
Without clean data, generating insights becomes difficult. Sifting through data to answer a hypothesis is a time drain, and it’s hard to find meaning in the muddle. It’s also easier to make errors with unintegrated data, so a lot of those painstakingly gathered insights won’t be actionable. And if the process takes too long, they might not even be relevant any longer.
All of this sounds scary, but marketing analytics is hardly doom and gloom. When you set up the right tools and processes to avoid these problems, marketing analytics can and will have a positive impact on your team and your company as a whole.
Marketing analytics in practice: Reallocating budget to optimize ROI
E-learning company Evulpo was using its marketing budget fairly equally across the seven countries it operated in, including Switzerland. But digging into their data with Mixpanel allowed them to see that they have a better product-market fit in the German-speaking part of Switzerland than the French-speaking region; in fact, they realized it was almost three times better performing.
They used those insights to optimize their marketing strategy by targeting German-speaking geographies across digital and social campaigns and doubled their marketing ROI.
Learn here about how Mixpanel supports robust marketing analytics out of the box, enabling easy access to insights across today’s evolving acquisition channels.
How to implement marketing analytics
To reap the benefits of marketing analytics—and avoid the challenges that come from unintegrated tech stacks and disorganized data—marketers need to set up an analytics platform and process that will give them the insights they need to optimize marketing campaigns. There are several considerations to keep in mind before diving in.
Understand measurement goals
Before you set up your marketing analytics, think about what you’ll need to measure and what your marketing goals are. What KPIs do you need to track for campaigns, and how often will you need to report? Ecommerce companies will have different KPIs than SaaS companies, for example.
You’ll have the best sense of the KPIs you need to be tracking to measure marketing performance for your company. Your marketing KPIs should tie to your company’s overall growth strategy. Avoid vanity metrics that look good on paper but don’t tell you anything about how your campaigns are actually performing.
Some of the most common marketing analytics metrics include:
- Marketing qualified leads (MQLs) and sales qualified leads (SQLs)
- Customer acquisition cost (CAC)
- Customer lifetime value (CLV)
- Ad spend, and even more importantly, return on ad spend (ROAS)
- Conversion rate and conversions by cohort
- Cost per lead
- Cost per install
- Marketing attribution
The other thing to consider is how quickly you need access to data and reports. If you opt for a setup that requires technical support for each new query, you’re stuck at the mercy of your company’s busy data analysts who have many other requests to juggle. As mentioned above, you might not get access to the data you need until it’s too old to be useful.
Which brings us to our next consideration.
Define integration needs
For your marketing analytics tool to be useful, you’ll need something that integrates with the rest of your marketing stack. That’s especially true for any tools you want to use to run experiments and campaigns informed by data.
For example, your marketing analytics platform might help you uncover key user segments for retargeting. With the right integrations, you can use that data to take action with your other marketing tools, whether that’s sending those users emails with Mailchimp or a paid ad campaign through Meta and Google.
Most companies keep the bulk of their data in their data warehouse, so using an analytics tool that can seamlessly pull data from your warehouse is also pretty important.
Set up analytics funnels
Once you understand your goals and have found the right platform to connect to your marketing stack, you’ll want to set up analytics funnels.

Funnels show you a series of steps that a user takes that lead to conversion. They can tell you where leads drop off (which shows you where to optimize), how long it takes them to convert, or use UTM data to see which campaigns are most effective.
Build and share marketing analytics dashboards
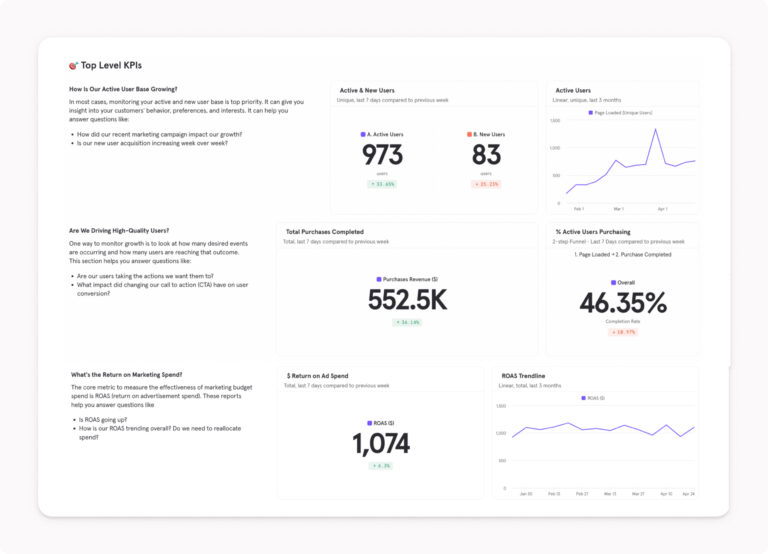
The easiest way to see all of your marketing KPIs in one place is to build a marketing analytics dashboard.
Your dashboards will give you high-level overviews of all of your marketing data and allow you to easily share that information with both the marketing team and the rest of the company. You can track things like multi-touch attribution and split your data down further into different reports.
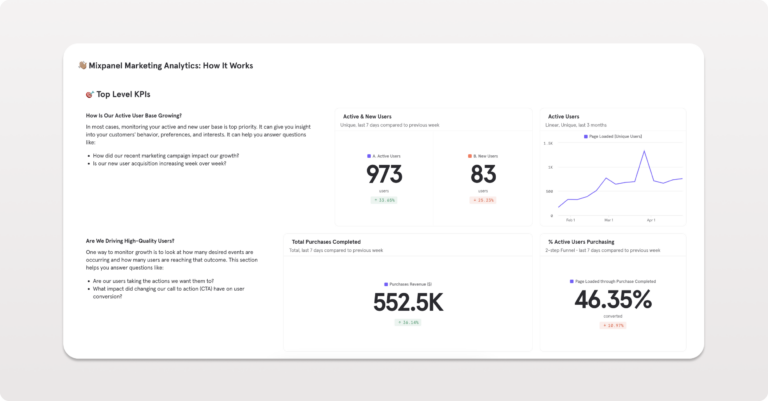
Here’s an example of a public marketing dashboard we’ve built in Mixpanel with dummy data to show you how to get the most out of your marketing analytics. You can also use Mixpanel’s customizable templates to start building your own.
Discover how to set up marketing analytics in Mixpanel in less than 20 minutes.
How to choose the right marketing analytics software
The changes brought by GA4 have left many marketing teams looking for intuitive, reliable solutions that track metrics across the entire funnel, across all platforms.
Every team (and every company) will have different priorities, but there are some key features that most marketers will want from an analytics solution.
- A/B testing allows you to compare the performance of different versions of websites, landing pages, ads, or emails. The right software will let you experiment, track results, and incorporate the feedback you receive quickly.
- Multi-touch attribution models give you insights into what campaigns or pages your users interacted with before converting. Ideally, you want to be able to track first-touch, last-touch, and everything your users interacted with in between, so that you get a complete picture of their journey.
- Ad-spend tracking is the first step to calculating ROAS. It tells you how much your ads cost and how well they are performing, so you can see which ones are performing best to allocate budgets and optimize campaigns accordingly.
- Session replay gives you granular insights into user behavior. You can watch replays of how visitors interact with your website or your campaigns, and spot roadblocks you might otherwise miss.
- Cohort segmentation and analysis is the key to tracking groups of leads and users over time. It allows you to tweak your marketing (and product) to cater to those users and increase engagement.
Here are a few questions to consider when you’re comparing different options:
- Does this software offer a centralized view of my marketing data?
- Does it integrate with the other tools in my marketing stack?
- Will the learning curve be too steep for my team? Does it have the templates and how-to guides I need to get started?
- Can I connect this software to my data warehouse?
- How will this solution help us reach our marketing goals?
These are just a few things to consider to help you think about what you need from a marketing analytics solution. Each team will prioritize different requirements. The most important thing is finding the right solution for you.
Learn more about how Mixpanel can help marketers acquire, engage, and convert more users.