How we track customer costs in Mixpanel
For Mixpanel, our customers’ data is the most expensive thing we pay for. Storing it, running queries… everything that goes into maintaining the most stable, reliable and fast user analytics platform, well, that’s what the infrastructure team does. It’s the unglamorous but essential work that keeps the lights on. And a lot of the time when things need fixing, it falls to our team to handle it.
So when we at Mixpanel realized we didn’t really know how much our customers’ data usage was costing us, we were excited to figure out the answer. On a macro level, sure, we knew that at the end of the month Google Cloud and SoftLayer were sending us bills. But we needed to get more granular. How much was each customer using? How was that related to what we were charging them for Mixpanel?
In general, we had a sense: how many queries was a customer running? How many events were they collecting? How many people profiles had they created? These were okay as far as proxies go, but proxies all the same. We knew it was possible to get a better answer, and being a data-driven company, we viewed it as imperative in this case to move from the simplest solution to the best reasonable solution.
Because the actual drivers of cost to Mixpanel from our customers on an infrastructure level is not merely the number of people profiles, it’s three things. First, it’s data ingestion. When end users hit our API, the data must flow from our edge servers to our database. The second piece is data storage. Simply put, holding data costs money. These two costs are pretty straightforward to attribute: they are directly proportional to the amount of data a customer sends us.
The third, and most complicated component of cost is compute, which is used to serve queries. Here, the volume-based approach fails because of Mixpanel’s query flexibility; different queries may require vastly different compute resources. There were two insights we used to attribute these costs. First, load per customer is bursty throughout the day, spiking from zero to maximum CPU as our customers come online and run queries. Second, we provision our cluster up-front to handle peak load, typically caused by our largest customers. By law of large numbers, the individual bursts spread nicely throughout the day for most of our smaller customers. But because we provision for peak, and peaks are caused mostly by larger customers, we need a way to attribute peaks.
We track a lot of system metrics directly into Mixpanel, including the amount of CPU used per query. To determine the contribution of a project to our “peaks”, we divided the day into 2 minute buckets and determined the peak customers for each bucket. Given Google Cloud’s pricing, we were able to say that 2 minutes of CPU cost X dollars, and from there it was simple arithmetic to assign each bucket to the project that dominated it. This worked well for the larger projects, which were particularly bursty/determined our costs. For our smaller projects, we use the simple, volume-based approach to weigh their CPU contribution to the overall usage—because we have so many of them, averages work out well.

A simple query

infra costs, sorted by customer
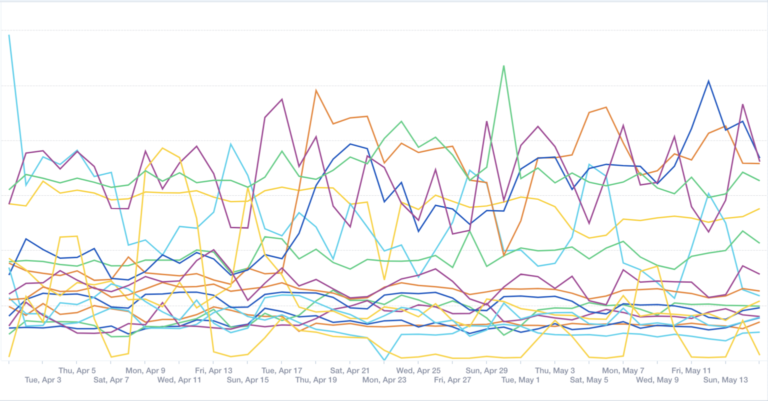
Once we stripped the problem down to that, we wrote a simple JQL query to pull the data from Mixpanel and imported the computed costs back into Mixpanel to easily visualize and share across the company.
One insight we were able to quantify from this data that may be useful to you, as a Mixpanel user, is that running one or two complex queries is drastically cheaper than running dozens of smaller queries, even if they’re both in service of answering the same question. There is a fixed cost to answer each query, and combining many smaller queries into a single more complex one when you query our API is better for both performance and cost.
Having this data in Mixpanel has helped us operationalize our business in multiple ways. First, it helps our support/solutions teams quantify customer cost, rather than rely on inexact heuristics like number of queries. Second, it enables the infrastructure team to prioritize efficiency improvements to maximize impact on our bottom-line, in a way the whole company understands. Finally, it helps our business team test various pricing models to find the one that best aligns our margin with customer value.
Having this knowledge in a shareable, easy-to-understand Mixpanel project allows teams across the company to deeply understand our costs without being blocked on the infrastructure team. Democratizing data allows for my team to get back to doing what’s important.


